|
Download Data (XLS File) |
|
||||||||
|
||||||||
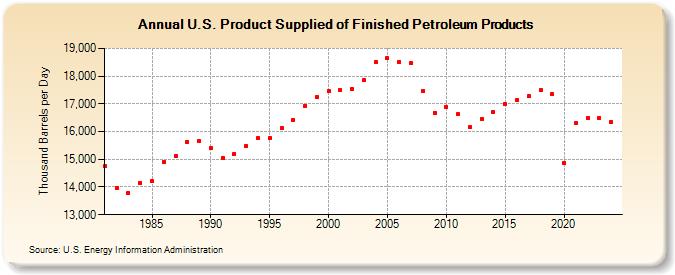
| U.S. Product Supplied of Finished Petroleum Products (Thousand Barrels per Day) | ||||||||
| Decade | Year-0 | Year-1 | Year-2 | Year-3 | Year-4 | Year-5 | Year-6 | Year-7 | Year-8 | Year-9 |
|---|---|---|---|---|---|---|---|---|---|---|
| 1980's | 14,745 | 13,958 | 13,793 | 14,146 | 14,207 | 14,917 | 15,119 | 15,625 | 15,659 | |
| 1990's | 15,405 | 15,058 | 15,201 | 15,482 | 15,757 | 15,766 | 16,130 | 16,429 | 16,936 | 17,240 |
| 2000's | 17,453 | 17,481 | 17,526 | 17,848 | 18,497 | 18,650 | 18,519 | 18,457 | 17,479 | 16,681 |
| 2010's | 16,902 | 16,619 | 16,161 | 16,458 | 16,696 | 16,990 | 17,147 | 17,279 | 17,484 | 17,341 |
| 2020's | 14,869 | 16,294 | 16,484 | 16,522 |
| - = No Data Reported; -- = Not Applicable; NA = Not Available; W = Withheld to avoid disclosure of individual company data. |
| Release Date: 3/29/2024 |
| Next Release Date: 8/30/2024 |