|
Download Data (XLS File) |
|
||||||||
|
||||||||
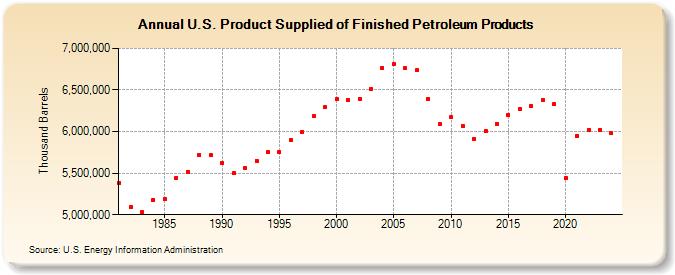
| U.S. Product Supplied of Finished Petroleum Products (Thousand Barrels) | ||||||||
| Decade | Year-0 | Year-1 | Year-2 | Year-3 | Year-4 | Year-5 | Year-6 | Year-7 | Year-8 | Year-9 |
|---|---|---|---|---|---|---|---|---|---|---|
| 1980's | 5,381,761 | 5,094,576 | 5,034,553 | 5,177,495 | 5,185,544 | 5,444,720 | 5,518,448 | 5,718,758 | 5,715,421 | |
| 1990's | 5,622,951 | 5,496,102 | 5,563,535 | 5,650,876 | 5,751,227 | 5,754,592 | 5,903,506 | 5,996,483 | 6,181,706 | 6,292,544 |
| 2000's | 6,387,943 | 6,380,383 | 6,396,890 | 6,514,551 | 6,769,833 | 6,807,354 | 6,759,254 | 6,736,961 | 6,397,212 | 6,088,739 |
| 2010's | 6,169,170 | 6,065,877 | 5,914,945 | 6,007,179 | 6,093,903 | 6,201,502 | 6,275,878 | 6,306,852 | 6,381,770 | 6,329,338 |
| 2020's | 5,442,152 | 5,947,391 | 6,016,579 | 6,030,702 |
| - = No Data Reported; -- = Not Applicable; NA = Not Available; W = Withheld to avoid disclosure of individual company data. |
| Release Date: 6/28/2024 |
| Next Release Date: 8/30/2024 |