|
Download Data (XLS File) |
|
||||||||
|
||||||||
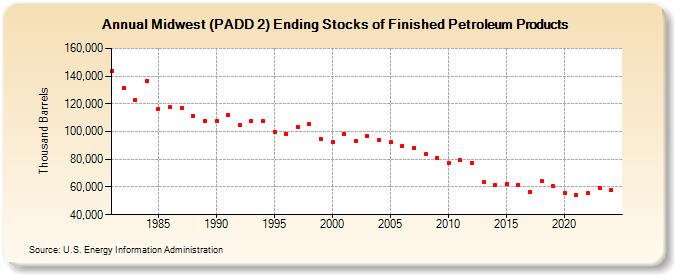
| Midwest (PADD 2) Ending Stocks of Finished Petroleum Products (Thousand Barrels) | ||||||||
| Decade | Year-0 | Year-1 | Year-2 | Year-3 | Year-4 | Year-5 | Year-6 | Year-7 | Year-8 | Year-9 |
|---|---|---|---|---|---|---|---|---|---|---|
| 1980's | 143,525 | 131,598 | 122,686 | 136,370 | 116,329 | 117,538 | 116,742 | 111,034 | 107,840 | |
| 1990's | 107,447 | 112,277 | 104,586 | 107,797 | 107,404 | 99,699 | 98,449 | 103,433 | 105,470 | 94,571 |
| 2000's | 92,244 | 98,365 | 93,538 | 96,916 | 94,056 | 92,454 | 89,309 | 88,019 | 83,461 | 81,178 |
| 2010's | 77,401 | 79,636 | 77,466 | 63,541 | 61,730 | 62,258 | 61,497 | 56,646 | 64,123 | 60,456 |
| 2020's | 55,784 | 54,381 | 55,369 | 59,552 |
| - = No Data Reported; -- = Not Applicable; NA = Not Available; W = Withheld to avoid disclosure of individual company data. |
| Release Date: 6/28/2024 |
| Next Release Date: 8/30/2024 |