|
Download Data (XLS File) |
|
||||||||
|
||||||||
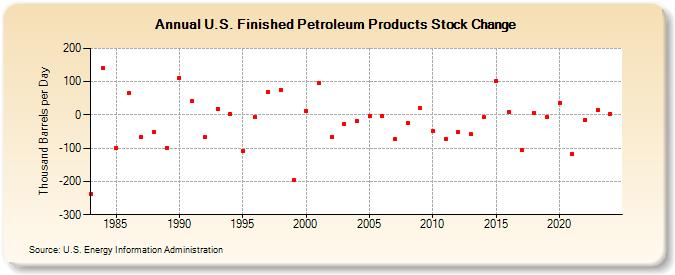
| U.S. Finished Petroleum Products Stock Change (Thousand Barrels per Day) | ||||||||
| Decade | Year-0 | Year-1 | Year-2 | Year-3 | Year-4 | Year-5 | Year-6 | Year-7 | Year-8 | Year-9 |
|---|---|---|---|---|---|---|---|---|---|---|
| 1980's | -237 | 140 | -100 | 65 | -66 | -50 | -99 | |||
| 1990's | 112 | 42 | -66 | 19 | 3 | -109 | -7 | 70 | 76 | -197 |
| 2000's | 12 | 96 | -65 | -27 | -19 | -3 | -3 | -73 | -25 | 20 |
| 2010's | -49 | -71 | -52 | -58 | -6 | 102 | 10 | -105 | 7 | -7 |
| 2020's | 35 | -117 | -15 | 16 |
| - = No Data Reported; -- = Not Applicable; NA = Not Available; W = Withheld to avoid disclosure of individual company data. |
| Release Date: 3/29/2024 |
| Next Release Date: 8/30/2024 |