|
Download Data (XLS File) |
|
||||||||
|
||||||||
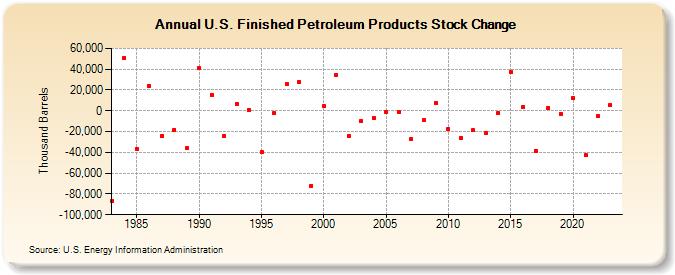
| U.S. Finished Petroleum Products Stock Change (Thousand Barrels) | ||||||||
| Decade | Year-0 | Year-1 | Year-2 | Year-3 | Year-4 | Year-5 | Year-6 | Year-7 | Year-8 | Year-9 |
|---|---|---|---|---|---|---|---|---|---|---|
| 1980's | -86,658 | 51,091 | -36,641 | 23,642 | -24,258 | -18,186 | -36,217 | |||
| 1990's | 40,860 | 15,486 | -24,049 | 6,769 | 932 | -39,607 | -2,510 | 25,700 | 27,558 | -72,046 |
| 2000's | 4,454 | 34,879 | -23,817 | -9,856 | -6,949 | -1,183 | -1,118 | -26,698 | -9,167 | 7,227 |
| 2010's | -17,744 | -25,809 | -18,912 | -21,201 | -2,226 | 37,288 | 3,821 | -38,269 | 2,613 | -2,727 |
| 2020's | 12,666 | -42,798 | -5,411 | 5,611 |
| - = No Data Reported; -- = Not Applicable; NA = Not Available; W = Withheld to avoid disclosure of individual company data. |
| Release Date: 8/30/2024 |
| Next Release Date: 8/29/2025 |