|
Download Data (XLS File) |
|
||||||||
|
||||||||
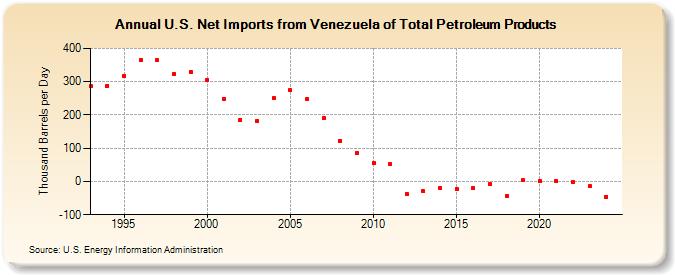
| U.S. Net Imports from Venezuela of Total Petroleum Products (Thousand Barrels per Day) | ||||||||
| Decade | Year-0 | Year-1 | Year-2 | Year-3 | Year-4 | Year-5 | Year-6 | Year-7 | Year-8 | Year-9 |
|---|---|---|---|---|---|---|---|---|---|---|
| 1990's | 286 | 288 | 317 | 365 | 364 | 324 | 330 | |||
| 2000's | 306 | 249 | 186 | 181 | 251 | 274 | 249 | 191 | 123 | 85 |
| 2010's | 55 | 51 | -38 | -30 | -20 | -22 | -21 | -8 | -43 | 3 |
| 2020's | 0 | 0 | -2 | -15 |
| - = No Data Reported; -- = Not Applicable; NA = Not Available; W = Withheld to avoid disclosure of individual company data. |
| Release Date: 3/29/2024 |
| Next Release Date: 8/30/2024 |