|
Download Data (XLS File) |
|
||||||||
|
||||||||
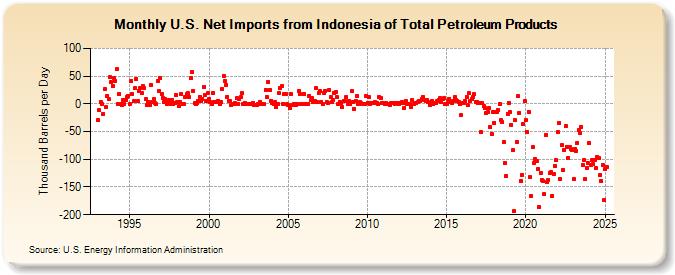
| U.S. Net Imports from Indonesia of Total Petroleum Products (Thousand Barrels per Day) | ||||||||
| Year | Jan | Feb | Mar | Apr | May | Jun | Jul | Aug | Sep | Oct | Nov | Dec |
|---|---|---|---|---|---|---|---|---|---|---|---|---|
| 1993 | -30 | -12 | 3 | 0 | -18 | 26 | -6 | 15 | 8 | 48 | 39 | 33 |
| 1994 | 46 | 41 | 62 | 0 | 18 | 0 | -3 | 7 | 0 | 7 | 13 | 15 |
| 1995 | 0 | 42 | 18 | 5 | 28 | 45 | 5 | 24 | 28 | 19 | 33 | 28 |
| 1996 | 8 | -3 | 3 | -3 | 34 | 4 | 8 | 1 | 0 | 42 | 24 | 46 |
| 1997 | 17 | 11 | 3 | 8 | 0 | 4 | 7 | 0 | 7 | 0 | 1 | 16 |
| 1998 | 3 | -4 | 3 | 18 | 0 | -1 | 12 | 17 | 19 | 12 | 46 | 57 |
| 1999 | 24 | 1 | -1 | 2 | 6 | 13 | 5 | 9 | 31 | 16 | 5 | 19 |
| 2000 | 9 | 3 | 0 | 20 | 3 | 3 | 4 | 6 | -1 | 3 | 27 | 51 |
| 2001 | 41 | 34 | 13 | 6 | 5 | -2 | 0 | 0 | 1 | 10 | 0 | 9 |
| 2002 | 13 | 19 | -1 | 2 | 0 | 0 | 0 | 0 | 0 | 1 | -2 | -2 |
| 2003 | -3 | 0 | 0 | 3 | 0 | 0 | -1 | 25 | 12 | 40 | 25 | 6 |
| 2004 | 1 | -1 | 3 | -5 | 0 | 19 | 28 | 32 | 0 | 17 | 18 | -1 |
| 2005 | -2 | -7 | 18 | -3 | 0 | -2 | -2 | 0 | 23 | 18 | 0 | 0 |
| 2006 | 18 | 0 | 0 | 0 | 15 | 7 | 10 | 3 | 5 | 28 | 3 | 20 |
| 2007 | 23 | 4 | 0 | 20 | 24 | 4 | 2 | 25 | 12 | 4 | 7 | 19 |
| 2008 | 22 | 12 | 0 | 4 | 1 | -6 | 5 | 5 | 12 | 0 | 5 | 0 |
| 2009 | 23 | 4 | -9 | 5 | 14 | 0 | 3 | 1 | 0 | 0 | 0 | 14 |
| 2010 | 2 | 12 | 0 | 1 | 2 | 2 | 3 | 2 | 0 | 12 | 11 | 2 |
| 2011 | 1 | 0 | 1 | 0 | 0 | -2 | 1 | 1 | 2 | 0 | 2 | 1 |
| 2012 | 0 | 1 | 3 | 1 | -7 | 5 | 0 | 0 | -1 | -5 | 7 | 0 |
| 2013 | 2 | 1 | 3 | 5 | 5 | 9 | 13 | 7 | 5 | 7 | 3 | -3 |
| 2014 | 2 | 5 | 0 | 1 | 2 | 5 | 7 | 10 | 4 | 9 | 10 | 0 |
| 2015 | 0 | 6 | 9 | 3 | 2 | 6 | 12 | 7 | 6 | 4 | 0 | -21 |
| 2016 | 2 | 2 | 5 | 12 | -3 | 19 | 6 | 8 | 13 | 17 | 4 | 4 |
| 2017 | 2 | 2 | -51 | 1 | -4 | -8 | -16 | -15 | -8 | -41 | -54 | -15 |
| 2018 | -34 | -15 | -15 | -11 | 0 | -30 | -33 | -69 | -107 | -130 | -18 | 2 |
| 2019 | -15 | -38 | -84 | -194 | -30 | -68 | 14 | -16 | -140 | -128 | -36 | 5 |
| 2020 | -30 | -51 | -14 | -132 | -166 | -78 | -106 | -100 | -103 | -117 | -186 | -124 |
| 2021 | -137 | -140 | -163 | -56 | -141 | -137 | -125 | -123 | -166 | -127 | -112 | -102 |
| 2022 | -51 | -34 | -136 | -75 | -119 | -83 | -40 | -78 | -97 | -77 | -82 | -84 |
| 2023 | -126 | -86 | -85 | -70 | -51 | -48 | -41 | -110 | -102 | -135 | -114 | -110 |
| 2024 | -71 | |||||||||||
| - = No Data Reported; -- = Not Applicable; NA = Not Available; W = Withheld to avoid disclosure of individual company data. |
| Release Date: 3/29/2024 |
| Next Release Date: 4/30/2024 |