|
Download Data (XLS File) |
|
||||||||
|
||||||||
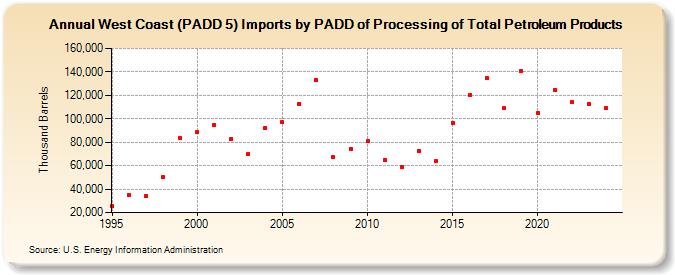
| West Coast (PADD 5) Imports by PADD of Processing of Total Petroleum Products (Thousand Barrels) | ||||||||
| Decade | Year-0 | Year-1 | Year-2 | Year-3 | Year-4 | Year-5 | Year-6 | Year-7 | Year-8 | Year-9 |
|---|---|---|---|---|---|---|---|---|---|---|
| 1990's | 25,360 | 35,139 | 34,090 | 50,142 | 83,208 | |||||
| 2000's | 88,643 | 94,647 | 82,774 | 70,136 | 92,453 | 96,879 | 112,925 | 133,173 | 67,029 | 74,189 |
| 2010's | 80,770 | 65,011 | 58,834 | 72,694 | 64,056 | 96,390 | 120,643 | 134,718 | 108,922 | 140,320 |
| 2020's | 105,214 | 124,785 | 113,891 | 112,833 |
| - = No Data Reported; -- = Not Applicable; NA = Not Available; W = Withheld to avoid disclosure of individual company data. |
| Release Date: 3/29/2024 |
| Next Release Date: 8/30/2024 |