|
Download Data (XLS File) |
|
||||||||
|
||||||||
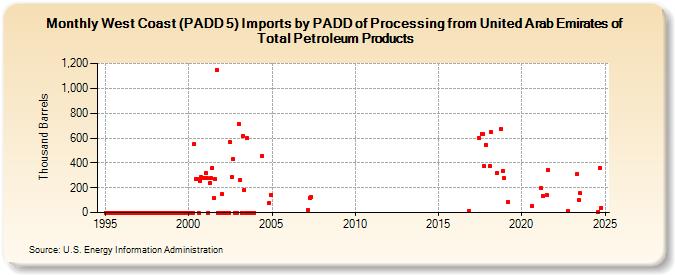
| West Coast (PADD 5) Imports by PADD of Processing from United Arab Emirates of Total Petroleum Products (Thousand Barrels) | ||||||||
| Year | Jan | Feb | Mar | Apr | May | Jun | Jul | Aug | Sep | Oct | Nov | Dec |
|---|---|---|---|---|---|---|---|---|---|---|---|---|
| 1995 | 0 | 0 | 0 | 0 | 0 | 0 | 0 | 0 | 0 | 0 | 0 | 0 |
| 1996 | 0 | 0 | 0 | 0 | 0 | 0 | 0 | 0 | 0 | 0 | 0 | 0 |
| 1997 | 0 | 0 | 0 | 0 | 0 | 0 | 0 | 0 | 0 | 0 | 0 | 0 |
| 1998 | 0 | 0 | 0 | 0 | 0 | 0 | 0 | 0 | 0 | 0 | 0 | 0 |
| 1999 | 0 | 0 | 0 | 0 | 0 | 0 | 0 | 0 | 0 | 0 | 0 | 0 |
| 2000 | 0 | 0 | 0 | 0 | 552 | 273 | 270 | 0 | 254 | 284 | 275 | 275 |
| 2001 | 320 | 277 | 0 | 238 | 276 | 361 | 121 | 270 | 1,148 | 0 | 0 | 0 |
| 2002 | 150 | 0 | 0 | 0 | 0 | 0 | 564 | 286 | 433 | 0 | 0 | 0 |
| 2003 | 711 | 265 | 0 | 618 | 182 | 0 | 600 | 0 | 0 | 0 | 0 | 0 |
| 2004 | 457 | 77 | 140 | |||||||||
| 2007 | 22 | 121 | 129 | |||||||||
| 2016 | 11 | |||||||||||
| 2017 | 597 | 635 | 634 | 372 | 547 | |||||||
| 2018 | 374 | 647 | 315 | 672 | 336 | 279 | ||||||
| 2019 | 88 | |||||||||||
| 2020 | 56 | |||||||||||
| 2021 | 194 | 135 | 144 | 341 | ||||||||
| 2022 | 10 | |||||||||||
| 2023 | 310 | 103 | 154 | |||||||||
| - = No Data Reported; -- = Not Applicable; NA = Not Available; W = Withheld to avoid disclosure of individual company data. |
| Release Date: 3/29/2024 |
| Next Release Date: 4/30/2024 |