|
Download Data (XLS File) |
|
||||||||
|
||||||||
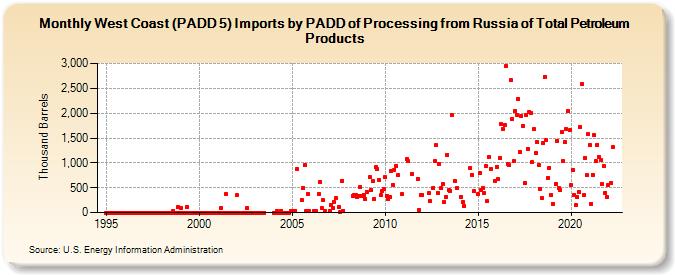
| West Coast (PADD 5) Imports by PADD of Processing from Russia of Total Petroleum Products (Thousand Barrels) | ||||||||
| Year | Jan | Feb | Mar | Apr | May | Jun | Jul | Aug | Sep | Oct | Nov | Dec |
|---|---|---|---|---|---|---|---|---|---|---|---|---|
| 1995 | 0 | 0 | 0 | 0 | 0 | 0 | 0 | 0 | 0 | 0 | 0 | 0 |
| 1996 | 0 | 0 | 0 | 0 | 0 | 0 | 0 | 0 | 0 | 0 | 0 | 0 |
| 1997 | 0 | 0 | 0 | 0 | 0 | 0 | 0 | 0 | 0 | 0 | 0 | 0 |
| 1998 | 0 | 0 | 0 | 0 | 0 | 0 | 0 | 29 | 0 | 0 | 107 | 0 |
| 1999 | 92 | 0 | 0 | 0 | 108 | 0 | 0 | 0 | 0 | 0 | 0 | 0 |
| 2000 | 0 | 0 | 0 | 0 | 0 | 0 | 0 | 0 | 0 | 0 | 0 | 0 |
| 2001 | 0 | 0 | 99 | 0 | 0 | 372 | 0 | 0 | 0 | 0 | 0 | 0 |
| 2002 | 348 | 0 | 0 | 0 | 0 | 0 | 0 | 95 | 0 | 0 | 0 | 0 |
| 2003 | 0 | 0 | 0 | 0 | 0 | 0 | 0 | |||||
| 2004 | 0 | 0 | 37 | 0 | 0 | 37 | 0 | 0 | 0 | 0 | 0 | 38 |
| 2005 | 37 | 36 | 877 | 260 | 498 | 953 | 38 | 379 | 32 | |||
| 2006 | 36 | 37 | 373 | 624 | 91 | 243 | 37 | |||||
| 2007 | 37 | 150 | 89 | 218 | 284 | 118 | 13 | 644 | 37 | |||
| 2008 | 338 | 352 | 351 | 312 | 341 | 515 | 342 | 362 | 275 | |||
| 2009 | 420 | 709 | 450 | 627 | 269 | 907 | 874 | 661 | 345 | 434 | 468 | |
| 2010 | 710 | 340 | 272 | 322 | 838 | 564 | 863 | 938 | 749 | 373 | ||
| 2011 | 1,082 | 1,029 | 785 | 683 | 55 | 351 | ||||||
| 2012 | 360 | 387 | 230 | 501 | 1,030 | 1,351 | 390 | 983 | ||||
| 2013 | 485 | 580 | 206 | 315 | 1,168 | 444 | 437 | 1,958 | 630 | 490 | ||
| 2014 | 319 | 204 | 131 | 901 | 761 | 428 | ||||||
| 2015 | 367 | 804 | 461 | 495 | 390 | 927 | 228 | 1,114 | 883 | 643 | ||
| 2016 | 924 | 673 | 1,094 | 1,775 | 1,686 | 1,768 | 2,949 | 968 | 953 | 2,665 | 1,881 | 1,035 |
| 2017 | 2,052 | 1,973 | 2,289 | 1,228 | 1,943 | 1,744 | 590 | 1,964 | 1,282 | 2,019 | 2,010 | 1,008 |
| 2018 | 1,674 | 1,190 | 1,428 | 956 | 477 | 297 | 1,403 | 2,735 | 1,460 | 701 | 902 | 360 |
| 2019 | 179 | 578 | 1,448 | 500 | 450 | 1,622 | 1,030 | 1,417 | 1,682 | 2,036 | 1,655 | |
| 2020 | 556 | 864 | 357 | 147 | 304 | 405 | 1,724 | 2,591 | 347 | 1,105 | 749 | 1,575 |
| 2021 | 1,355 | 182 | 764 | 1,554 | 1,028 | 1,367 | 1,121 | 1,057 | 567 | 937 | 399 | 312 |
| 2022 | 557 | 598 | 1,317 | |||||||||
| - = No Data Reported; -- = Not Applicable; NA = Not Available; W = Withheld to avoid disclosure of individual company data. |
| Release Date: 3/29/2024 |
| Next Release Date: 4/30/2024 |