|
Download Data (XLS File) |
|
||||||||
|
||||||||
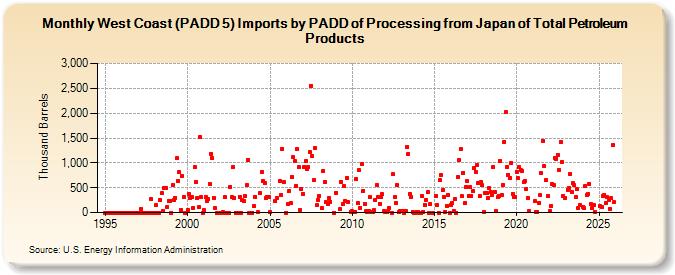
| West Coast (PADD 5) Imports by PADD of Processing from Japan of Total Petroleum Products (Thousand Barrels) | ||||||||
| Year | Jan | Feb | Mar | Apr | May | Jun | Jul | Aug | Sep | Oct | Nov | Dec |
|---|---|---|---|---|---|---|---|---|---|---|---|---|
| 1995 | 1 | 0 | 0 | 1 | 1 | 0 | 0 | 0 | 0 | 0 | 0 | 0 |
| 1996 | 0 | 0 | 0 | 0 | 0 | 0 | 0 | 0 | 0 | 0 | 0 | 0 |
| 1997 | 0 | 0 | 75 | 0 | 0 | 0 | 0 | 0 | 1 | 272 | 0 | 0 |
| 1998 | 0 | 149 | 0 | 0 | 262 | 390 | 40 | 503 | 491 | 115 | 234 | 240 |
| 1999 | 1 | 557 | 256 | 299 | 1,090 | 635 | 811 | 60 | 740 | 317 | 0 | 0 |
| 2000 | 55 | 368 | 301 | 304 | 100 | 909 | 611 | 295 | 103 | 1,525 | 307 | 0 |
| 2001 | 44 | 309 | 235 | 269 | 584 | 1,187 | 1,092 | 301 | 89 | 0 | 1 | 0 |
| 2002 | 1 | 1 | 2 | 312 | 1 | 1 | 0 | 520 | 306 | 916 | 301 | 0 |
| 2003 | 0 | 0 | 314 | 1 | 250 | 240 | 324 | 550 | 1,064 | 0 | 0 | 0 |
| 2004 | 128 | 323 | 2 | 388 | 826 | 630 | 603 | 301 | 315 | 320 | ||
| 2005 | 2 | 226 | 293 | 641 | 354 | 1,287 | 612 | |||||
| 2006 | 1 | 163 | 427 | 187 | 723 | 1,110 | 1,033 | 536 | 1,271 | 914 | 42 | 477 |
| 2007 | 380 | 917 | 1,032 | 883 | 917 | 1,219 | 2,552 | 1,129 | 647 | 1,303 | 146 | 259 |
| 2008 | 335 | 84 | 846 | 624 | 215 | 173 | 296 | 214 | 1 | |||
| 2009 | 399 | 65 | 610 | 169 | 534 | 235 | 705 | 219 | 17 | |||
| 2010 | 30 | 2 | 17 | 673 | 187 | 851 | 100 | 979 | 439 | 182 | 22 | 18 |
| 2011 | 35 | 311 | 20 | 16 | 43 | 255 | 555 | 315 | 178 | 315 | 365 | 26 |
| 2012 | 2 | 14 | 37 | 101 | 1 | 769 | 313 | 201 | 546 | 2 | 34 | |
| 2013 | 25 | 1 | 26 | 1,325 | 1,180 | 383 | 322 | 20 | 1 | 1 | 17 | |
| 2014 | 17 | 1 | 1 | 332 | 16 | 158 | 253 | 407 | 1 | 177 | 1 | |
| 2015 | 332 | 150 | 1 | 649 | 752 | 450 | 309 | 15 | 142 | 350 | 1 | |
| 2016 | 154 | 197 | 22 | 275 | 1 | 715 | 1,053 | 1,277 | 328 | 801 | 193 | 521 |
| 2017 | 628 | 339 | 519 | 335 | 438 | 893 | 826 | 960 | 592 | 338 | 611 | 546 |
| 2018 | 21 | 398 | 401 | 296 | 490 | 414 | 348 | 914 | 417 | 23 | 311 | 341 |
| 2019 | 1,046 | 357 | 559 | 1,427 | 2,019 | 925 | 765 | 705 | 999 | 375 | 311 | 319 |
| 2020 | 822 | 686 | 910 | 852 | 841 | 606 | 632 | 473 | 295 | 31 | ||
| 2021 | 225 | 18 | 20 | 201 | 346 | 788 | 1,447 | 936 | 654 | 330 | ||
| 2022 | 25 | 136 | 576 | 548 | 1,099 | 1,085 | 1,166 | 861 | 1,424 | 1,020 | 339 | 300 |
| 2023 | 461 | 486 | 783 | 410 | 589 | 550 | 321 | 468 | 90 | 151 | ||
| 2024 | 119 | 90 | 525 | 353 | ||||||||
| - = No Data Reported; -- = Not Applicable; NA = Not Available; W = Withheld to avoid disclosure of individual company data. |
| Release Date: 6/28/2024 |
| Next Release Date: 7/31/2024 |