|
Download Data (XLS File) |
|
||||||||
|
||||||||
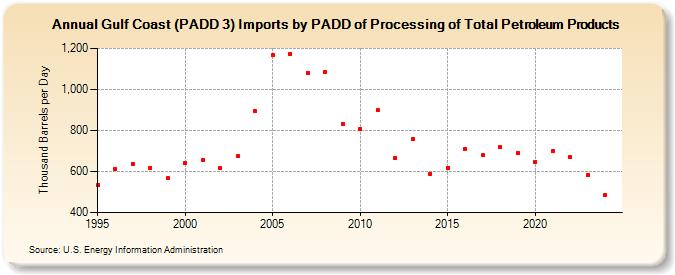
| Gulf Coast (PADD 3) Imports by PADD of Processing of Total Petroleum Products (Thousand Barrels per Day) | ||||||||
| Decade | Year-0 | Year-1 | Year-2 | Year-3 | Year-4 | Year-5 | Year-6 | Year-7 | Year-8 | Year-9 |
|---|---|---|---|---|---|---|---|---|---|---|
| 1990's | 533 | 612 | 639 | 619 | 568 | |||||
| 2000's | 643 | 657 | 617 | 674 | 893 | 1,166 | 1,174 | 1,082 | 1,086 | 833 |
| 2010's | 807 | 898 | 668 | 759 | 589 | 619 | 709 | 679 | 721 | 691 |
| 2020's | 647 | 698 | 669 | 583 |
| - = No Data Reported; -- = Not Applicable; NA = Not Available; W = Withheld to avoid disclosure of individual company data. |
| Release Date: 6/28/2024 |
| Next Release Date: 8/30/2024 |