|
Download Data (XLS File) |
|
||||||||
|
||||||||
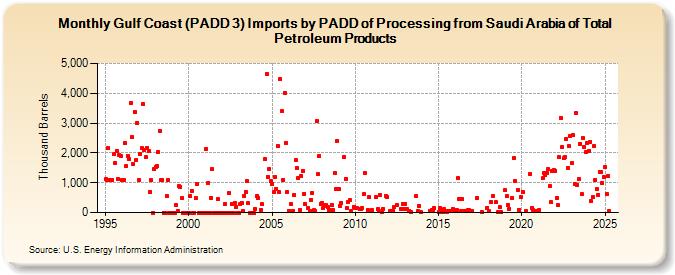
| Gulf Coast (PADD 3) Imports by PADD of Processing from Saudi Arabia of Total Petroleum Products (Thousand Barrels) | ||||||||
| Year | Jan | Feb | Mar | Apr | May | Jun | Jul | Aug | Sep | Oct | Nov | Dec |
|---|---|---|---|---|---|---|---|---|---|---|---|---|
| 1995 | 1,110 | 1,090 | 2,178 | 1,076 | 1,078 | 1,089 | 1,949 | 1,674 | 2,073 | 1,115 | 1,934 | 1,893 |
| 1996 | 1,083 | 1,083 | 2,325 | 1,567 | 1,897 | 1,800 | 3,686 | 2,527 | 1,613 | 3,379 | 1,767 | 3,010 |
| 1997 | 1,087 | 1,968 | 2,151 | 3,637 | 2,113 | 1,853 | 2,171 | 2,053 | 698 | 1,077 | 0 | 1,454 |
| 1998 | 1,527 | 1,560 | 2,037 | 2,740 | 1,078 | 1,078 | 0 | 0 | 542 | 1,080 | 0 | 0 |
| 1999 | 0 | 0 | 0 | 237 | 65 | 881 | 866 | 493 | 0 | 0 | 0 | 0 |
| 2000 | 0 | 562 | 737 | 0 | 0 | 494 | 969 | 0 | 0 | 0 | 0 | 0 |
| 2001 | 2,131 | 0 | 996 | 0 | 497 | 1,468 | 0 | 0 | 0 | 439 | 0 | 0 |
| 2002 | 0 | 0 | 287 | 0 | 0 | 655 | 0 | 279 | 0 | 332 | 198 | 0 |
| 2003 | 0 | 276 | 337 | 66 | 558 | 700 | 1,047 | 310 | 0 | 0 | 0 | 0 |
| 2004 | 114 | 541 | 504 | 97 | 276 | 1,787 | 4,653 | 1,207 | 1,462 | 1,046 | ||
| 2005 | 970 | 677 | 1,209 | 792 | 2,228 | 674 | 4,469 | 3,392 | 1,107 | 4,021 | 2,347 | 697 |
| 2006 | 68 | 273 | 68 | 595 | 1,759 | 1,507 | 1,159 | 75 | 1,241 | 1,407 | 638 | |
| 2007 | 282 | 142 | 68 | 437 | 658 | 76 | 57 | 3,073 | 1,277 | 1,904 | 299 | |
| 2008 | 332 | 148 | 222 | 249 | 198 | 81 | 72 | 260 | 71 | 1,315 | 805 | 2,394 |
| 2009 | 775 | 221 | 321 | 1,871 | 1,142 | 144 | 347 | 421 | 65 | 194 | ||
| 2010 | 149 | 149 | 104 | 111 | 148 | 607 | 1,312 | 88 | 509 | |||
| 2011 | 74 | 522 | 109 | 42 | 584 | 18 | 133 | 569 | 508 | |||
| 2012 | 57 | 67 | 69 | 183 | 249 | 128 | 294 | 108 | ||||
| 2013 | 299 | 117 | 66 | 5 | 540 | 40 | 214 | 20 | ||||
| 2014 | 45 | 97 | 37 | 150 | ||||||||
| 2015 | 17 | 145 | 22 | 10 | 103 | 37 | 30 | 45 | 45 | 120 | 87 | |
| 2016 | 89 | 1,150 | 446 | 43 | 460 | 40 | 45 | 74 | 71 | |||
| 2017 | 37 | 501 | 22 | 163 | ||||||||
| 2018 | 36 | 362 | 543 | 352 | 35 | 170 | 14 | |||||
| 2019 | 742 | 568 | 253 | 120 | 497 | 1,826 | 1,046 | 773 | 97 | 526 | ||
| 2020 | 677 | 50 | 1,301 | 162 | 83 | 64 | 45 | |||||
| 2021 | 72 | 1,144 | 1,323 | 1,249 | 1,339 | 1,446 | 895 | 342 | 1,379 | 1,442 | ||
| 2022 | 1,404 | 497 | 245 | 1,854 | 3,178 | 2,196 | 1,814 | 1,850 | 2,471 | 1,501 | 2,222 | 2,567 |
| 2023 | 1,661 | 2,591 | 959 | 3,340 | 937 | 1,131 | 2,316 | 609 | 2,484 | 2,197 | 2,025 | 2,334 |
| 2024 | 2,068 | |||||||||||
| - = No Data Reported; -- = Not Applicable; NA = Not Available; W = Withheld to avoid disclosure of individual company data. |
| Release Date: 3/29/2024 |
| Next Release Date: 4/30/2024 |