|
Download Data (XLS File) |
|
||||||||
|
||||||||
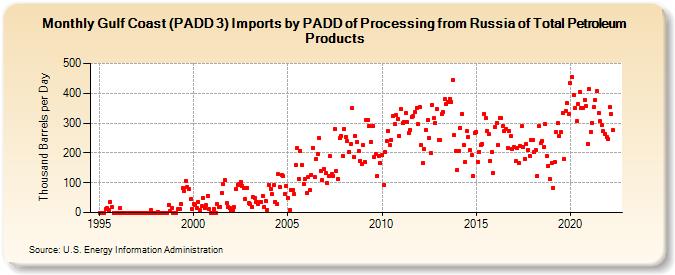
| Gulf Coast (PADD 3) Imports by PADD of Processing from Russia of Total Petroleum Products (Thousand Barrels per Day) | ||||||||
| Year | Jan | Feb | Mar | Apr | May | Jun | Jul | Aug | Sep | Oct | Nov | Dec |
|---|---|---|---|---|---|---|---|---|---|---|---|---|
| 1995 | 0 | 0 | 0 | 0 | 12 | 15 | 8 | 37 | 18 | 0 | 0 | 0 |
| 1996 | 0 | 14 | 0 | 0 | 0 | 0 | 0 | 0 | 0 | 0 | 0 | 0 |
| 1997 | 0 | 0 | 0 | 0 | 0 | 0 | 0 | 0 | 0 | 7 | 0 | 0 |
| 1998 | 0 | 3 | 0 | 0 | 0 | 0 | 0 | 0 | 26 | 4 | 16 | 0 |
| 1999 | 0 | 0 | 11 | 13 | 28 | 81 | 72 | 107 | 85 | 79 | 44 | 11 |
| 2000 | 29 | 26 | 15 | 35 | 8 | 21 | 49 | 14 | 24 | 57 | 11 | 0 |
| 2001 | 0 | 13 | 0 | 28 | 19 | 20 | 66 | 97 | 108 | 32 | 20 | 14 |
| 2002 | 5 | 9 | 18 | 79 | 92 | 95 | 104 | 90 | 82 | 44 | 83 | 32 |
| 2003 | 28 | 20 | 51 | 49 | 37 | 30 | 36 | 34 | 55 | 18 | 38 | 9 |
| 2004 | 94 | 80 | 62 | 91 | 36 | 28 | 128 | 85 | 126 | 122 | 63 | 89 |
| 2005 | 50 | 7 | 75 | 75 | 61 | 161 | 217 | 114 | 207 | 160 | 96 | 111 |
| 2006 | 65 | 120 | 74 | 127 | 218 | 118 | 180 | 198 | 250 | 141 | 109 | 146 |
| 2007 | 134 | 98 | 124 | 190 | 128 | 123 | 281 | 138 | 112 | 249 | 258 | 189 |
| 2008 | 280 | 255 | 240 | 204 | 229 | 350 | 188 | 258 | 238 | 206 | 174 | 162 |
| 2009 | 226 | 171 | 311 | 311 | 291 | 236 | 290 | 188 | 196 | 123 | 189 | 167 |
| 2010 | 192 | 92 | 204 | 240 | 275 | 227 | 244 | 323 | 296 | 328 | 313 | 258 |
| 2011 | 347 | 299 | 304 | 333 | 303 | 266 | 277 | 321 | 325 | 337 | 351 | 296 |
| 2012 | 353 | 226 | 166 | 213 | 278 | 311 | 250 | 199 | 361 | 316 | 300 | 349 |
| 2013 | 244 | 242 | 330 | 337 | 380 | 363 | 372 | 382 | 372 | 444 | 259 | 206 |
| 2014 | 142 | 208 | 284 | 332 | 227 | 170 | 273 | 253 | 209 | 193 | 122 | 268 |
| 2015 | 269 | 170 | 204 | 227 | 230 | 332 | 317 | 274 | 262 | 174 | 203 | 133 |
| 2016 | 288 | 301 | 227 | 316 | 316 | 289 | 272 | 281 | 216 | 272 | 257 | 213 |
| 2017 | 220 | 172 | 216 | 166 | 222 | 290 | 219 | 180 | 230 | 209 | 191 | 245 |
| 2018 | 243 | 203 | 210 | 124 | 290 | 232 | 239 | 220 | 297 | 189 | 157 | 111 |
| 2019 | 167 | 84 | 170 | 269 | 300 | 257 | 269 | 334 | 179 | 342 | 366 | 331 |
| 2020 | 434 | 455 | 395 | 350 | 306 | 363 | 403 | 351 | 352 | 379 | 357 | 231 |
| 2021 | 413 | 271 | 302 | 354 | 379 | 408 | 335 | 306 | 293 | 273 | 265 | 255 |
| 2022 | 247 | 354 | 329 | 276 | ||||||||
| - = No Data Reported; -- = Not Applicable; NA = Not Available; W = Withheld to avoid disclosure of individual company data. |
| Release Date: 3/29/2024 |
| Next Release Date: 4/30/2024 |