|
Download Data (XLS File) |
|
||||||||
|
||||||||
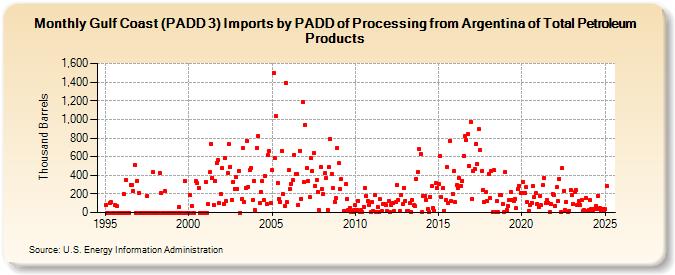
| Gulf Coast (PADD 3) Imports by PADD of Processing from Argentina of Total Petroleum Products (Thousand Barrels) | ||||||||
| Year | Jan | Feb | Mar | Apr | May | Jun | Jul | Aug | Sep | Oct | Nov | Dec |
|---|---|---|---|---|---|---|---|---|---|---|---|---|
| 1995 | 81 | 0 | 0 | 100 | 109 | 0 | 0 | 79 | 72 | 0 | 0 | 0 |
| 1996 | 0 | 197 | 0 | 351 | 0 | 0 | 298 | 301 | 234 | 507 | 0 | 342 |
| 1997 | 211 | 0 | 0 | 0 | 0 | 0 | 179 | 0 | 0 | 0 | 435 | 0 |
| 1998 | 0 | 0 | 0 | 425 | 208 | 0 | 0 | 233 | 0 | 0 | 0 | 0 |
| 1999 | 0 | 0 | 0 | 0 | 0 | 65 | 0 | 0 | 0 | 340 | 0 | 0 |
| 2000 | 0 | 186 | 72 | 0 | 0 | 336 | 316 | 264 | 0 | 0 | 0 | 0 |
| 2001 | 330 | 0 | 88 | 430 | 739 | 374 | 83 | 340 | 531 | 562 | 100 | 200 |
| 2002 | 476 | 97 | 588 | 125 | 422 | 734 | 494 | 140 | 333 | 253 | 378 | 258 |
| 2003 | 447 | 0 | 143 | 690 | 113 | 267 | 773 | 275 | 454 | 477 | 134 | 341 |
| 2004 | 23 | 694 | 823 | 105 | 226 | 338 | 131 | 391 | 92 | 613 | 657 | 104 |
| 2005 | 452 | 1,499 | 589 | 1,033 | 321 | 150 | 114 | 662 | 195 | 75 | 1,392 | 109 |
| 2006 | 454 | 255 | 311 | 345 | 620 | 419 | 419 | 83 | 664 | 150 | 1,190 | 327 |
| 2007 | 941 | 480 | 339 | 162 | 586 | 448 | 640 | 290 | 351 | 225 | 24 | 491 |
| 2008 | 251 | 198 | 421 | 369 | 29 | 490 | 791 | 417 | 260 | 116 | 153 | 695 |
| 2009 | 529 | 254 | 359 | 19 | 302 | 147 | 23 | 53 | 1 | 2 | 23 | |
| 2010 | 78 | 32 | 129 | 1 | 28 | 1 | 64 | 264 | 174 | 122 | 86 | 1 |
| 2011 | 113 | 16 | 188 | 1 | 60 | 1 | 142 | 16 | 94 | 91 | 80 | 15 |
| 2012 | 124 | 1 | 84 | 102 | 16 | 110 | 297 | 139 | 12 | 192 | 87 | 268 |
| 2013 | 125 | 16 | 20 | 98 | 2 | 137 | 77 | 70 | 360 | 436 | 678 | 626 |
| 2014 | 9 | 180 | 177 | 133 | 35 | 4 | 170 | 281 | 49 | 19 | 313 | 261 |
| 2015 | 311 | 609 | 165 | 263 | 21 | 136 | 490 | 101 | 773 | 122 | 203 | 448 |
| 2016 | 109 | 292 | 265 | 368 | 290 | 343 | 611 | 819 | 774 | 838 | 504 | 973 |
| 2017 | 143 | 448 | 465 | 740 | 526 | 894 | 669 | 441 | 244 | 114 | 226 | 128 |
| 2018 | 415 | 158 | 445 | 4 | 453 | 4 | 120 | 3 | 186 | 191 | 92 | 3 |
| 2019 | 436 | 31 | 73 | 139 | 217 | 132 | 128 | 149 | 44 | 250 | 290 | 213 |
| 2020 | 214 | 331 | 213 | 270 | 112 | 22 | 77 | 104 | 283 | 166 | 205 | 96 |
| 2021 | 60 | 183 | 76 | 294 | 369 | 105 | 133 | 104 | 3 | 88 | 201 | 192 |
| 2022 | 73 | 271 | 123 | 365 | 4 | 474 | 231 | 25 | 117 | 4 | 19 | 238 |
| 2023 | 184 | 93 | 216 | 238 | 80 | 119 | 83 | 130 | 16 | 27 | 154 | 12 |
| 2024 | 27 | |||||||||||
| - = No Data Reported; -- = Not Applicable; NA = Not Available; W = Withheld to avoid disclosure of individual company data. |
| Release Date: 3/29/2024 |
| Next Release Date: 4/30/2024 |