|
Download Data (XLS File) |
|
||||||||
|
||||||||
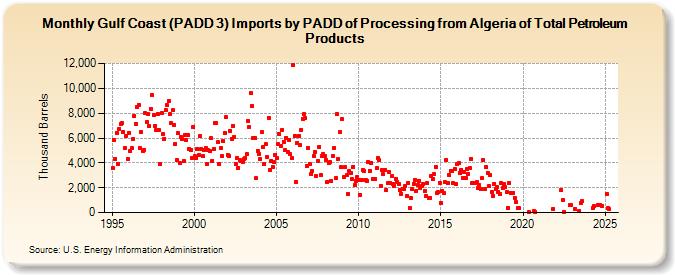
| Gulf Coast (PADD 3) Imports by PADD of Processing from Algeria of Total Petroleum Products (Thousand Barrels) | ||||||||
| Year | Jan | Feb | Mar | Apr | May | Jun | Jul | Aug | Sep | Oct | Nov | Dec |
|---|---|---|---|---|---|---|---|---|---|---|---|---|
| 1995 | 3,596 | 5,870 | 4,320 | 6,423 | 3,938 | 6,766 | 7,137 | 7,214 | 6,487 | 5,169 | 6,194 | 4,298 |
| 1996 | 6,433 | 4,964 | 5,158 | 5,944 | 7,774 | 7,158 | 8,512 | 8,666 | 5,187 | 6,484 | 4,947 | 5,064 |
| 1997 | 7,974 | 7,285 | 7,950 | 6,967 | 8,368 | 9,446 | 7,844 | 6,959 | 6,653 | 7,965 | 6,615 | 3,894 |
| 1998 | 8,005 | 6,316 | 5,935 | 8,216 | 8,667 | 8,979 | 7,909 | 7,169 | 8,246 | 7,061 | 5,539 | 4,240 |
| 1999 | 6,373 | 4,008 | 6,092 | 5,937 | 4,114 | 6,243 | 5,848 | 6,233 | 5,145 | 5,022 | 4,416 | 6,869 |
| 2000 | 4,550 | 4,359 | 5,127 | 4,596 | 6,137 | 5,115 | 4,520 | 5,072 | 5,213 | 3,869 | 5,010 | 4,916 |
| 2001 | 5,976 | 4,176 | 5,096 | 7,221 | 7,181 | 5,646 | 3,912 | 5,215 | 4,520 | 5,770 | 6,411 | 7,661 |
| 2002 | 4,649 | 4,566 | 6,590 | 5,949 | 6,998 | 6,108 | 3,945 | 4,384 | 3,600 | 4,228 | 4,153 | 4,097 |
| 2003 | 4,279 | 4,395 | 4,701 | 7,391 | 6,885 | 9,588 | 8,592 | 5,974 | 5,993 | 2,754 | 4,957 | 4,715 |
| 2004 | 4,302 | 6,458 | 5,273 | 3,885 | 5,490 | 4,482 | 7,640 | 3,449 | 4,145 | 3,696 | 4,039 | 4,667 |
| 2005 | 4,358 | 5,523 | 6,301 | 5,390 | 6,629 | 5,689 | 5,027 | 6,009 | 4,846 | 5,872 | 4,689 | 4,361 |
| 2006 | 11,910 | 6,171 | 2,495 | 5,637 | 6,157 | 5,453 | 6,681 | 7,514 | 7,916 | 7,602 | 3,761 | 5,192 |
| 2007 | 3,946 | 3,078 | 3,339 | 4,569 | 4,912 | 2,959 | 4,154 | 5,317 | 2,997 | 4,542 | 4,729 | 4,562 |
| 2008 | 4,269 | 2,497 | 3,981 | 4,105 | 2,529 | 4,543 | 5,210 | 2,777 | 7,923 | 4,317 | 6,445 | 3,643 |
| 2009 | 7,524 | 2,844 | 3,651 | 2,990 | 1,489 | 3,310 | 3,193 | 2,682 | 3,701 | 2,254 | 2,533 | 2,846 |
| 2010 | 2,588 | 1,436 | 2,648 | 3,435 | 3,354 | 2,661 | 2,528 | 4,064 | 3,382 | 4,014 | 2,710 | 2,682 |
| 2011 | 2,717 | 3,586 | 4,383 | 4,208 | 2,122 | 3,386 | 3,086 | 3,449 | 1,805 | 2,390 | 3,286 | 2,385 |
| 2012 | 2,922 | 2,280 | 2,177 | 2,733 | 2,448 | 2,337 | 1,804 | 1,528 | 1,919 | 1,918 | 2,114 | 1,362 |
| 2013 | 2,417 | 399 | 1,179 | 1,876 | 2,310 | 2,625 | 1,757 | 2,254 | 2,533 | 2,002 | 2,157 | 2,313 |
| 2014 | 1,740 | 1,353 | 2,375 | 1,198 | 1,210 | 2,961 | 2,697 | 3,075 | 3,697 | 1,588 | 1,629 | 2,400 |
| 2015 | 782 | 1,769 | 1,601 | 2,428 | 4,232 | 2,348 | 3,003 | 3,369 | 3,347 | 2,341 | 3,496 | 2,282 |
| 2016 | 3,896 | 3,978 | 3,151 | 3,448 | 2,788 | 3,240 | 2,782 | 3,503 | 3,127 | 3,620 | 4,346 | 2,411 |
| 2017 | 2,393 | 2,414 | 2,425 | 1,995 | 2,237 | 1,900 | 2,755 | 4,230 | 1,924 | 3,687 | 3,189 | 2,121 |
| 2018 | 2,996 | 1,676 | 1,344 | 2,309 | 1,877 | 2,024 | 1,680 | 1,496 | 2,376 | 1,981 | 2,265 | 2,043 |
| 2019 | 1,623 | 390 | 2,415 | 1,586 | 1,600 | 1,584 | 1,192 | 824 | 364 | 344 | ||
| 2020 | 16 | 117 | 80 | |||||||||
| 2021 | 301 | |||||||||||
| 2022 | 1,800 | 1,029 | 84 | 591 | 593 | |||||||
| 2023 | 319 | 127 | 782 | 916 | ||||||||
| - = No Data Reported; -- = Not Applicable; NA = Not Available; W = Withheld to avoid disclosure of individual company data. |
| Release Date: 3/29/2024 |
| Next Release Date: 4/30/2024 |