|
Download Data (XLS File) |
|
||||||||
|
||||||||
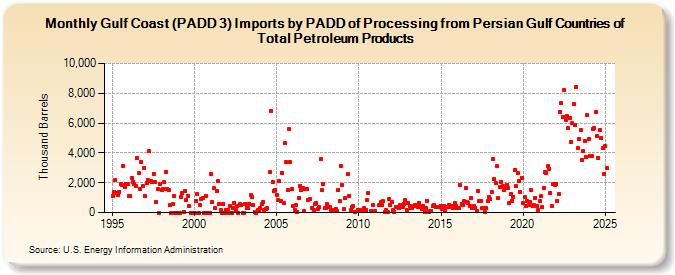
| Gulf Coast (PADD 3) Imports by PADD of Processing from Persian Gulf Countries of Total Petroleum Products (Thousand Barrels) | ||||||||
| Year | Jan | Feb | Mar | Apr | May | Jun | Jul | Aug | Sep | Oct | Nov | Dec |
|---|---|---|---|---|---|---|---|---|---|---|---|---|
| 1995 | 1,110 | 1,385 | 2,178 | 1,299 | 1,200 | 1,406 | 1,949 | 1,816 | 3,117 | 1,724 | 1,934 | 1,893 |
| 1996 | 1,083 | 1,083 | 2,325 | 2,066 | 1,897 | 1,800 | 3,686 | 2,670 | 1,613 | 3,379 | 1,767 | 3,010 |
| 1997 | 1,087 | 1,968 | 2,151 | 4,098 | 2,113 | 2,024 | 2,616 | 2,053 | 698 | 1,558 | 0 | 1,914 |
| 1998 | 1,527 | 1,560 | 2,037 | 2,740 | 1,604 | 1,526 | 479 | 0 | 542 | 1,080 | 0 | 0 |
| 1999 | 0 | 0 | 1,062 | 1,319 | 65 | 1,464 | 866 | 1,140 | 414 | 0 | 0 | 0 |
| 2000 | 0 | 773 | 1,265 | 0 | 487 | 936 | 969 | 0 | 1,096 | 0 | 0 | 0 |
| 2001 | 2,595 | 713 | 1,615 | 278 | 1,452 | 2,111 | 551 | 167 | 0 | 606 | 0 | 180 |
| 2002 | 177 | 0 | 454 | 0 | 321 | 655 | 173 | 461 | 0 | 552 | 539 | 0 |
| 2003 | 0 | 586 | 337 | 276 | 558 | 1,147 | 1,047 | 492 | 49 | 0 | 179 | 173 |
| 2004 | 314 | 541 | 686 | 183 | 262 | 276 | 2,743 | 6,788 | 2,059 | 1,462 | 1,495 | |
| 2005 | 1,169 | 859 | 2,089 | 792 | 2,665 | 674 | 4,651 | 3,392 | 1,490 | 5,573 | 3,384 | 1,561 |
| 2006 | 471 | 184 | 497 | 68 | 952 | 1,759 | 1,507 | 1,655 | 75 | 1,563 | 1,589 | 848 |
| 2007 | 901 | 324 | 172 | 606 | 658 | 225 | 369 | 3,589 | 1,481 | 1,904 | 299 | |
| 2008 | 332 | 547 | 358 | 386 | 198 | 191 | 72 | 260 | 120 | 1,480 | 805 | 3,154 |
| 2009 | 1,840 | 221 | 951 | 2,562 | 1,142 | 144 | 347 | 421 | 65 | 194 | ||
| 2010 | 149 | 149 | 104 | 293 | 148 | 817 | 1,312 | 88 | 509 | |||
| 2011 | 74 | 522 | 703 | 496 | 766 | 18 | 171 | 60 | 890 | 508 | ||
| 2012 | 729 | 175 | 67 | 342 | 392 | 291 | 520 | 360 | 574 | 852 | 157 | |
| 2013 | 633 | 414 | 300 | 293 | 449 | 528 | 369 | 632 | 365 | 259 | 410 | |
| 2014 | 38 | 331 | 803 | 68 | 84 | 95 | 411 | 532 | 402 | 402 | 360 | 374 |
| 2015 | 433 | 240 | 473 | 78 | 394 | 390 | 507 | 396 | 460 | 315 | 636 | 473 |
| 2016 | 276 | 295 | 1,853 | 584 | 495 | 760 | 1,673 | 714 | 668 | 443 | 988 | 312 |
| 2017 | 428 | 305 | 98 | 1,464 | 759 | 781 | 299 | 331 | 21 | 305 | 752 | 1,070 |
| 2018 | 888 | 1,408 | 3,617 | 2,241 | 1,962 | 3,103 | 959 | 1,720 | 2,083 | 1,760 | 1,488 | 1,745 |
| 2019 | 1,845 | 1,636 | 637 | 1,240 | 804 | 1,064 | 2,883 | 1,777 | 2,649 | 2,149 | 1,370 | 2,334 |
| 2020 | 619 | 1,011 | 432 | 763 | 480 | 717 | 1,494 | 445 | 502 | 1,009 | 449 | 202 |
| 2021 | 776 | 1,110 | 358 | 1,667 | 2,695 | 2,642 | 3,113 | 2,952 | 1,328 | 454 | 1,937 | 1,867 |
| 2022 | 1,939 | 795 | 1,261 | 6,725 | 7,316 | 6,440 | 8,213 | 6,230 | 6,444 | 5,655 | 6,326 | 4,735 |
| 2023 | 6,032 | 7,297 | 5,862 | 8,433 | 4,326 | 4,954 | 5,554 | 3,548 | 4,143 | 4,832 | 3,735 | 6,569 |
| 2024 | 4,950 | |||||||||||
| - = No Data Reported; -- = Not Applicable; NA = Not Available; W = Withheld to avoid disclosure of individual company data. |
| Release Date: 3/29/2024 |
| Next Release Date: 4/30/2024 |