|
Download Data (XLS File) |
|
||||||||
|
||||||||
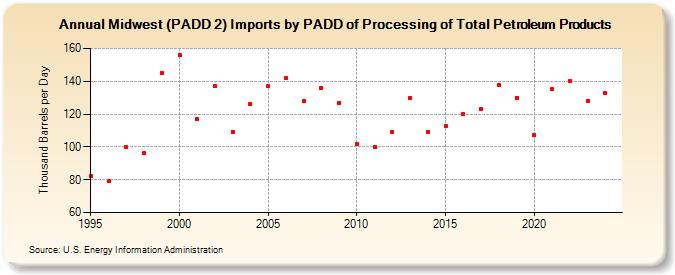
| Midwest (PADD 2) Imports by PADD of Processing of Total Petroleum Products (Thousand Barrels per Day) | ||||||||
| Decade | Year-0 | Year-1 | Year-2 | Year-3 | Year-4 | Year-5 | Year-6 | Year-7 | Year-8 | Year-9 |
|---|---|---|---|---|---|---|---|---|---|---|
| 1990's | 82 | 79 | 100 | 96 | 145 | |||||
| 2000's | 156 | 117 | 137 | 109 | 126 | 137 | 142 | 128 | 136 | 127 |
| 2010's | 102 | 100 | 109 | 130 | 109 | 113 | 120 | 123 | 138 | 130 |
| 2020's | 107 | 135 | 140 | 127 |
| - = No Data Reported; -- = Not Applicable; NA = Not Available; W = Withheld to avoid disclosure of individual company data. |
| Release Date: 6/28/2024 |
| Next Release Date: 8/30/2024 |