|
Download Data (XLS File) |
|
||||||||
|
||||||||
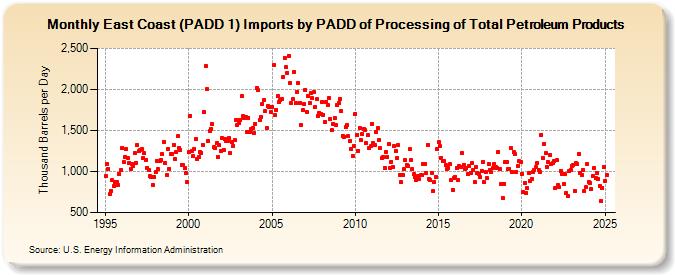
| East Coast (PADD 1) Imports by PADD of Processing of Total Petroleum Products (Thousand Barrels per Day) | ||||||||
| Year | Jan | Feb | Mar | Apr | May | Jun | Jul | Aug | Sep | Oct | Nov | Dec |
|---|---|---|---|---|---|---|---|---|---|---|---|---|
| 1995 | 948 | 1,087 | 1,031 | 722 | 767 | 892 | 822 | 870 | 871 | 836 | 969 | 1,013 |
| 1996 | 1,291 | 1,115 | 1,182 | 1,273 | 1,168 | 1,103 | 1,026 | 1,094 | 1,072 | 1,224 | 1,107 | 1,323 |
| 1997 | 1,247 | 1,257 | 1,269 | 1,164 | 1,220 | 1,138 | 1,046 | 1,018 | 942 | 937 | 839 | 934 |
| 1998 | 994 | 1,129 | 1,025 | 1,133 | 1,146 | 1,211 | 1,364 | 1,106 | 954 | 1,277 | 1,031 | 1,212 |
| 1999 | 1,216 | 1,329 | 1,152 | 1,232 | 1,427 | 1,290 | 1,263 | 1,085 | 1,076 | 1,043 | 978 | 868 |
| 2000 | 1,239 | 1,680 | 1,247 | 1,185 | 1,275 | 1,401 | 1,153 | 1,182 | 1,243 | 1,230 | 1,329 | 1,727 |
| 2001 | 2,283 | 2,000 | 1,371 | 1,491 | 1,518 | 1,574 | 1,295 | 1,289 | 1,343 | 1,181 | 1,319 | 1,247 |
| 2002 | 1,409 | 1,264 | 1,395 | 1,367 | 1,367 | 1,407 | 1,220 | 1,360 | 1,312 | 1,379 | 1,626 | 1,571 |
| 2003 | 1,597 | 1,630 | 1,918 | 1,672 | 1,648 | 1,663 | 1,487 | 1,656 | 1,478 | 1,523 | 1,534 | 1,472 |
| 2004 | 1,579 | 2,022 | 1,987 | 1,629 | 1,667 | 1,827 | 1,872 | 1,734 | 1,536 | 1,797 | 1,780 | 1,720 |
| 2005 | 1,787 | 2,296 | 1,684 | 1,749 | 1,918 | 1,843 | 1,869 | 1,882 | 2,154 | 2,387 | 2,268 | 2,206 |
| 2006 | 2,413 | 2,079 | 1,833 | 1,879 | 2,218 | 1,830 | 1,973 | 2,079 | 1,840 | 1,568 | 1,746 | 1,820 |
| 2007 | 1,994 | 1,726 | 1,915 | 1,840 | 1,956 | 1,890 | 1,965 | 1,787 | 1,878 | 1,681 | 1,716 | 1,702 |
| 2008 | 1,848 | 1,692 | 1,609 | 1,847 | 1,814 | 1,893 | 1,637 | 1,503 | 1,584 | 1,654 | 1,565 | 1,815 |
| 2009 | 1,836 | 1,884 | 1,737 | 1,436 | 1,418 | 1,538 | 1,564 | 1,427 | 1,369 | 1,272 | 1,188 | 1,314 |
| 2010 | 1,705 | 1,450 | 1,255 | 1,533 | 1,385 | 1,451 | 1,524 | 1,502 | 1,342 | 1,439 | 1,283 | 1,306 |
| 2011 | 1,580 | 1,348 | 1,319 | 1,476 | 1,530 | 1,388 | 1,281 | 1,161 | 1,179 | 1,046 | 1,240 | 1,181 |
| 2012 | 1,333 | 1,048 | 1,120 | 1,052 | 1,310 | 1,245 | 1,166 | 1,317 | 959 | 867 | 961 | 1,032 |
| 2013 | 1,136 | 1,080 | 1,063 | 1,271 | 1,146 | 1,026 | 966 | 937 | 900 | 945 | 904 | 953 |
| 2014 | 960 | 1,089 | 1,096 | 982 | 1,327 | 914 | 898 | 977 | 757 | 874 | 937 | 1,278 |
| 2015 | 1,358 | 1,307 | 1,165 | 1,134 | 1,127 | 1,081 | 1,031 | 1,043 | 1,086 | 891 | 778 | 919 |
| 2016 | 937 | 1,046 | 897 | 1,064 | 1,054 | 1,221 | 1,081 | 1,031 | 1,048 | 965 | 1,071 | 978 |
| 2017 | 1,099 | 1,015 | 878 | 1,059 | 978 | 974 | 930 | 1,007 | 1,116 | 867 | 997 | 915 |
| 2018 | 1,090 | 1,016 | 990 | 1,038 | 1,089 | 1,053 | 1,047 | 1,241 | 1,028 | 853 | 676 | 854 |
| 2019 | 1,111 | 1,120 | 1,030 | 1,031 | 1,282 | 997 | 1,237 | 1,210 | 998 | 1,073 | 1,124 | 1,119 |
| 2020 | 975 | 750 | 865 | 741 | 796 | 976 | 881 | 909 | 998 | 1,017 | 1,051 | 1,109 |
| 2021 | 1,018 | 999 | 1,448 | 1,165 | 1,341 | 1,221 | 1,057 | 1,113 | 1,204 | 1,094 | 1,098 | 1,123 |
| 2022 | 795 | 1,137 | 830 | 807 | 1,012 | 965 | 846 | 965 | 739 | 703 | 1,012 | 1,019 |
| 2023 | 1,067 | 1,079 | 765 | 1,100 | 1,093 | 1,214 | 977 | 960 | 1,012 | 761 | 806 | 1,086 |
| 2024 | 875 | |||||||||||
| - = No Data Reported; -- = Not Applicable; NA = Not Available; W = Withheld to avoid disclosure of individual company data. |
| Release Date: 3/29/2024 |
| Next Release Date: 4/30/2024 |