|
Download Data (XLS File) |
|
||||||||
|
||||||||
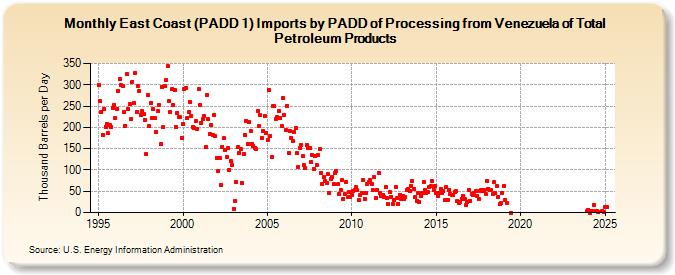
| East Coast (PADD 1) Imports by PADD of Processing from Venezuela of Total Petroleum Products (Thousand Barrels per Day) | ||||||||
| Year | Jan | Feb | Mar | Apr | May | Jun | Jul | Aug | Sep | Oct | Nov | Dec |
|---|---|---|---|---|---|---|---|---|---|---|---|---|
| 1995 | 299 | 261 | 235 | 182 | 244 | 202 | 209 | 186 | 206 | 200 | 246 | 253 |
| 1996 | 221 | 244 | 286 | 313 | 299 | 296 | 237 | 204 | 326 | 242 | 254 | 219 |
| 1997 | 307 | 257 | 328 | 236 | 297 | 286 | 228 | 238 | 232 | 218 | 137 | 276 |
| 1998 | 203 | 257 | 223 | 242 | 221 | 190 | 238 | 252 | 160 | 295 | 200 | 297 |
| 1999 | 312 | 344 | 261 | 235 | 289 | 252 | 288 | 202 | 234 | 224 | 224 | 176 |
| 2000 | 207 | 290 | 292 | 223 | 235 | 260 | 227 | 200 | 199 | 214 | 197 | 289 |
| 2001 | 253 | 211 | 219 | 227 | 154 | 277 | 219 | 184 | 206 | 183 | 230 | 179 |
| 2002 | 129 | 97 | 129 | 64 | 155 | 174 | 146 | 131 | 151 | 101 | 121 | 112 |
| 2003 | 9 | 27 | 72 | 154 | 141 | 149 | 70 | 137 | 182 | 216 | 161 | 212 |
| 2004 | 192 | 162 | 156 | 152 | 150 | 239 | 203 | 228 | 175 | 191 | 227 | 187 |
| 2005 | 170 | 288 | 180 | 131 | 250 | 250 | 220 | 224 | 238 | 221 | 204 | 270 |
| 2006 | 230 | 193 | 251 | 140 | 192 | 176 | 168 | 190 | 198 | 139 | 107 | 152 |
| 2007 | 158 | 133 | 111 | 104 | 159 | 151 | 152 | 119 | 135 | 103 | 133 | 112 |
| 2008 | 134 | 149 | 93 | 67 | 84 | 73 | 69 | 91 | 47 | 79 | 83 | 67 |
| 2009 | 92 | 98 | 66 | 44 | 54 | 77 | 33 | 44 | 72 | 37 | 49 | 37 |
| 2010 | 42 | 51 | 54 | 60 | 52 | 29 | 41 | 45 | 77 | 33 | 47 | 67 |
| 2011 | 71 | 76 | 66 | 53 | 84 | 34 | 54 | 94 | 47 | 39 | 42 | 36 |
| 2012 | 59 | 34 | 20 | 48 | 37 | 20 | 30 | 61 | 34 | 21 | 42 | 33 |
| 2013 | 40 | 33 | 37 | 53 | 55 | 51 | 62 | 74 | 56 | 37 | 28 | 45 |
| 2014 | 25 | 40 | 46 | 71 | 52 | 46 | 48 | 61 | 62 | 74 | 54 | 63 |
| 2015 | 46 | 39 | 46 | 55 | 45 | 50 | 30 | 59 | 30 | 54 | 43 | 42 |
| 2016 | 42 | 48 | 50 | 27 | 23 | 25 | 31 | 40 | 31 | 17 | 25 | 53 |
| 2017 | 28 | 44 | 41 | 45 | 50 | 40 | 31 | 51 | 53 | 51 | 53 | 44 |
| 2018 | 73 | 56 | 52 | 52 | 43 | 72 | 45 | 62 | 36 | 19 | 22 | 47 |
| 2019 | 63 | 29 | 22 | 0 | ||||||||
| 2023 | 3 | |||||||||||
| 2024 | 7 | 0 | 3 | 4 | ||||||||
| - = No Data Reported; -- = Not Applicable; NA = Not Available; W = Withheld to avoid disclosure of individual company data. |
| Release Date: 6/28/2024 |
| Next Release Date: 7/31/2024 |