|
Download Data (XLS File) |
|
||||||||
|
||||||||
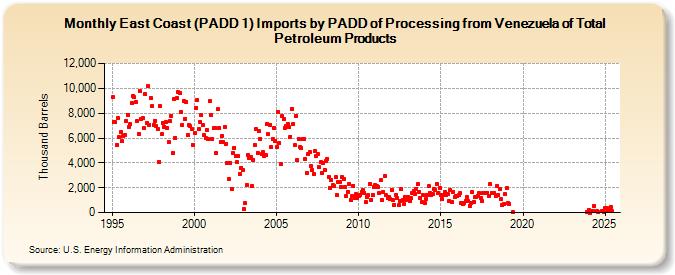
| East Coast (PADD 1) Imports by PADD of Processing from Venezuela of Total Petroleum Products (Thousand Barrels) | ||||||||
| Year | Jan | Feb | Mar | Apr | May | Jun | Jul | Aug | Sep | Oct | Nov | Dec |
|---|---|---|---|---|---|---|---|---|---|---|---|---|
| 1995 | 9,280 | 7,310 | 7,288 | 5,451 | 7,578 | 6,047 | 6,466 | 5,761 | 6,191 | 6,213 | 7,376 | 7,858 |
| 1996 | 6,864 | 7,090 | 8,853 | 9,384 | 9,269 | 8,883 | 7,341 | 6,332 | 9,784 | 7,509 | 7,611 | 6,794 |
| 1997 | 9,515 | 7,208 | 10,153 | 7,077 | 9,215 | 8,570 | 7,076 | 7,388 | 6,962 | 6,766 | 4,110 | 8,570 |
| 1998 | 6,298 | 7,192 | 6,898 | 7,253 | 6,844 | 5,697 | 7,372 | 7,804 | 4,806 | 9,152 | 6,012 | 9,208 |
| 1999 | 9,675 | 9,626 | 8,081 | 7,050 | 8,950 | 7,563 | 8,929 | 6,276 | 7,016 | 6,945 | 6,733 | 5,461 |
| 2000 | 6,403 | 8,419 | 9,055 | 6,695 | 7,300 | 7,813 | 7,041 | 6,209 | 5,962 | 6,644 | 5,906 | 8,959 |
| 2001 | 7,831 | 5,907 | 6,786 | 6,817 | 4,784 | 8,297 | 6,797 | 5,702 | 6,187 | 5,688 | 6,914 | 5,544 |
| 2002 | 3,999 | 2,710 | 4,008 | 1,926 | 4,815 | 5,230 | 4,518 | 4,047 | 4,529 | 3,119 | 3,615 | 3,465 |
| 2003 | 271 | 744 | 2,243 | 4,626 | 4,377 | 4,483 | 2,155 | 4,232 | 5,452 | 6,705 | 4,831 | 6,557 |
| 2004 | 5,952 | 4,702 | 4,848 | 4,564 | 4,640 | 7,165 | 6,298 | 7,078 | 5,247 | 5,918 | 6,822 | 5,794 |
| 2005 | 5,280 | 8,075 | 5,588 | 3,916 | 7,749 | 7,509 | 6,815 | 6,932 | 7,154 | 6,860 | 6,122 | 8,367 |
| 2006 | 7,124 | 5,412 | 7,784 | 4,209 | 5,952 | 5,266 | 5,210 | 5,902 | 5,942 | 4,299 | 3,217 | 4,708 |
| 2007 | 4,883 | 3,712 | 3,437 | 3,106 | 4,933 | 4,522 | 4,699 | 3,691 | 4,042 | 3,192 | 3,987 | 3,466 |
| 2008 | 4,169 | 4,315 | 2,889 | 2,006 | 2,589 | 2,180 | 2,150 | 2,824 | 1,398 | 2,449 | 2,483 | 2,090 |
| 2009 | 2,840 | 2,733 | 2,043 | 1,307 | 1,682 | 2,302 | 1,013 | 1,352 | 2,173 | 1,132 | 1,476 | 1,141 |
| 2010 | 1,301 | 1,416 | 1,689 | 1,811 | 1,611 | 866 | 1,274 | 1,383 | 2,324 | 1,036 | 1,405 | 2,090 |
| 2011 | 2,216 | 2,118 | 2,061 | 1,590 | 2,594 | 1,024 | 1,663 | 2,925 | 1,398 | 1,197 | 1,269 | 1,107 |
| 2012 | 1,818 | 979 | 630 | 1,436 | 1,159 | 586 | 939 | 1,878 | 1,029 | 663 | 1,272 | 1,008 |
| 2013 | 1,242 | 931 | 1,133 | 1,582 | 1,709 | 1,523 | 1,921 | 2,287 | 1,684 | 1,154 | 841 | 1,393 |
| 2014 | 783 | 1,109 | 1,439 | 2,117 | 1,600 | 1,382 | 1,498 | 1,899 | 1,849 | 2,306 | 1,611 | 1,968 |
| 2015 | 1,435 | 1,093 | 1,438 | 1,659 | 1,406 | 1,486 | 938 | 1,826 | 888 | 1,680 | 1,284 | 1,313 |
| 2016 | 1,307 | 1,388 | 1,542 | 797 | 707 | 742 | 964 | 1,246 | 927 | 541 | 752 | 1,633 |
| 2017 | 880 | 1,233 | 1,268 | 1,344 | 1,563 | 1,210 | 953 | 1,585 | 1,585 | 1,596 | 1,588 | 1,373 |
| 2018 | 2,268 | 1,567 | 1,611 | 1,555 | 1,347 | 2,146 | 1,408 | 1,930 | 1,065 | 594 | 657 | 1,472 |
| 2019 | 1,952 | 803 | 689 | 7 | ||||||||
| 2023 | 84 | |||||||||||
| 2024 | 209 | |||||||||||
| - = No Data Reported; -- = Not Applicable; NA = Not Available; W = Withheld to avoid disclosure of individual company data. |
| Release Date: 3/29/2024 |
| Next Release Date: 4/30/2024 |