|
Download Data (XLS File) |
|
||||||||
|
||||||||
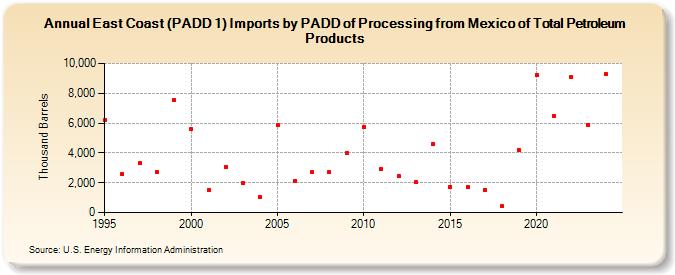
| East Coast (PADD 1) Imports by PADD of Processing from Mexico of Total Petroleum Products (Thousand Barrels) | ||||||||
| Decade | Year-0 | Year-1 | Year-2 | Year-3 | Year-4 | Year-5 | Year-6 | Year-7 | Year-8 | Year-9 |
|---|---|---|---|---|---|---|---|---|---|---|
| 1990's | 6,178 | 2,570 | 3,310 | 2,712 | 7,547 | |||||
| 2000's | 5,589 | 1,504 | 3,084 | 1,962 | 1,052 | 5,882 | 2,107 | 2,703 | 2,692 | 4,001 |
| 2010's | 5,757 | 2,913 | 2,422 | 2,040 | 4,600 | 1,744 | 1,713 | 1,497 | 421 | 4,171 |
| 2020's | 9,219 | 6,496 | 9,068 | 5,847 |
| - = No Data Reported; -- = Not Applicable; NA = Not Available; W = Withheld to avoid disclosure of individual company data. |
| Release Date: 8/30/2024 |
| Next Release Date: 8/29/2025 |