|
Download Data (XLS File) |
|
||||||||
|
||||||||
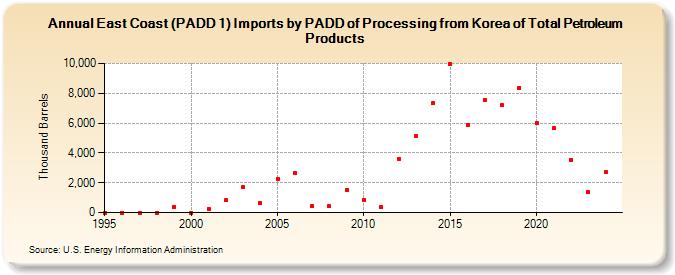
| East Coast (PADD 1) Imports by PADD of Processing from Korea of Total Petroleum Products (Thousand Barrels) | ||||||||
| Decade | Year-0 | Year-1 | Year-2 | Year-3 | Year-4 | Year-5 | Year-6 | Year-7 | Year-8 | Year-9 |
|---|---|---|---|---|---|---|---|---|---|---|
| 1990's | 0 | 0 | 0 | 0 | 399 | |||||
| 2000's | 0 | 264 | 810 | 1,710 | 642 | 2,259 | 2,639 | 433 | 422 | 1,541 |
| 2010's | 871 | 387 | 3,620 | 5,125 | 7,320 | 9,957 | 5,871 | 7,530 | 7,184 | 8,377 |
| 2020's | 5,995 | 5,666 | 3,539 | 1,377 |
| - = No Data Reported; -- = Not Applicable; NA = Not Available; W = Withheld to avoid disclosure of individual company data. |
| Release Date: 6/28/2024 |
| Next Release Date: 8/30/2024 |