|
Download Data (XLS File) |
|
||||||||
|
||||||||
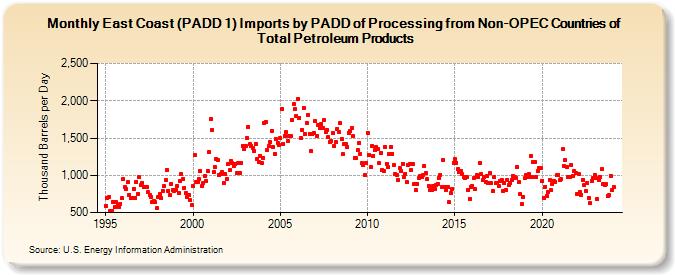
| East Coast (PADD 1) Imports by PADD of Processing from Non-OPEC Countries of Total Petroleum Products (Thousand Barrels per Day) | ||||||||
| Year | Jan | Feb | Mar | Apr | May | Jun | Jul | Aug | Sep | Oct | Nov | Dec |
|---|---|---|---|---|---|---|---|---|---|---|---|---|
| 1995 | 590 | 689 | 707 | 526 | 521 | 645 | 569 | 637 | 602 | 578 | 620 | 690 |
| 1996 | 947 | 839 | 813 | 906 | 739 | 695 | 695 | 820 | 700 | 910 | 754 | 971 |
| 1997 | 871 | 901 | 840 | 844 | 849 | 771 | 736 | 712 | 643 | 653 | 637 | 557 |
| 1998 | 708 | 749 | 702 | 793 | 850 | 931 | 1,076 | 793 | 730 | 888 | 797 | 793 |
| 1999 | 799 | 861 | 767 | 917 | 1,014 | 952 | 832 | 768 | 710 | 729 | 662 | 600 |
| 2000 | 853 | 1,266 | 915 | 915 | 950 | 1,055 | 854 | 898 | 988 | 923 | 1,060 | 1,312 |
| 2001 | 1,755 | 1,613 | 1,041 | 1,109 | 1,221 | 1,208 | 1,001 | 1,021 | 1,040 | 896 | 1,021 | 951 |
| 2002 | 1,152 | 1,067 | 1,197 | 1,161 | 1,129 | 1,149 | 1,030 | 1,161 | 1,036 | 1,171 | 1,397 | 1,347 |
| 2003 | 1,387 | 1,495 | 1,651 | 1,417 | 1,396 | 1,368 | 1,321 | 1,424 | 1,212 | 1,181 | 1,264 | 1,161 |
| 2004 | 1,236 | 1,702 | 1,720 | 1,342 | 1,387 | 1,440 | 1,598 | 1,383 | 1,289 | 1,482 | 1,438 | 1,412 |
| 2005 | 1,494 | 1,884 | 1,424 | 1,524 | 1,575 | 1,462 | 1,523 | 1,525 | 1,746 | 1,951 | 1,884 | 1,792 |
| 2006 | 2,030 | 1,773 | 1,500 | 1,614 | 1,904 | 1,556 | 1,708 | 1,814 | 1,560 | 1,325 | 1,557 | 1,574 |
| 2007 | 1,728 | 1,523 | 1,679 | 1,631 | 1,689 | 1,630 | 1,739 | 1,575 | 1,614 | 1,511 | 1,453 | 1,462 |
| 2008 | 1,568 | 1,395 | 1,452 | 1,622 | 1,586 | 1,697 | 1,487 | 1,279 | 1,416 | 1,426 | 1,378 | 1,568 |
| 2009 | 1,596 | 1,629 | 1,530 | 1,238 | 1,228 | 1,336 | 1,430 | 1,291 | 1,166 | 1,141 | 1,007 | 1,171 |
| 2010 | 1,571 | 1,276 | 1,105 | 1,394 | 1,265 | 1,334 | 1,379 | 1,359 | 1,159 | 1,302 | 1,073 | 1,055 |
| 2011 | 1,385 | 1,157 | 1,113 | 1,291 | 1,381 | 1,292 | 1,138 | 1,011 | 1,001 | 937 | 1,093 | 1,055 |
| 2012 | 1,156 | 977 | 1,021 | 905 | 1,143 | 1,151 | 1,070 | 1,157 | 879 | 796 | 887 | 959 |
| 2013 | 988 | 978 | 1,002 | 1,125 | 1,032 | 946 | 856 | 802 | 801 | 863 | 822 | 874 |
| 2014 | 887 | 963 | 1,008 | 844 | 1,203 | 842 | 806 | 845 | 637 | 760 | 816 | 1,171 |
| 2015 | 1,216 | 1,169 | 1,078 | 1,046 | 1,054 | 1,011 | 977 | 961 | 977 | 808 | 687 | 846 |
| 2016 | 856 | 958 | 815 | 1,004 | 971 | 1,163 | 1,011 | 936 | 976 | 912 | 988 | 900 |
| 2017 | 1,027 | 896 | 784 | 974 | 891 | 897 | 859 | 927 | 938 | 790 | 897 | 803 |
| 2018 | 934 | 872 | 894 | 936 | 997 | 974 | 959 | 1,116 | 905 | 746 | 613 | 709 |
| 2019 | 961 | 1,006 | 971 | 1,012 | 1,258 | 980 | 1,182 | 1,179 | 975 | 1,055 | 1,094 | 1,098 |
| 2020 | 929 | 694 | 848 | 727 | 777 | 934 | 796 | 877 | 924 | 916 | 998 | 1,003 |
| 2021 | 934 | 946 | 1,349 | 1,122 | 1,199 | 1,114 | 982 | 983 | 1,144 | 996 | 1,053 | 1,035 |
| 2022 | 754 | 1,016 | 776 | 738 | 943 | 869 | 789 | 899 | 698 | 627 | 924 | 966 |
| 2023 | 1,007 | 964 | 678 | 940 | 971 | 1,083 | 882 | 872 | 879 | 717 | 729 | 995 |
| 2024 | 799 | |||||||||||
| - = No Data Reported; -- = Not Applicable; NA = Not Available; W = Withheld to avoid disclosure of individual company data. |
| Release Date: 3/29/2024 |
| Next Release Date: 4/30/2024 |