|
Download Data (XLS File) |
|
||||||||
|
||||||||
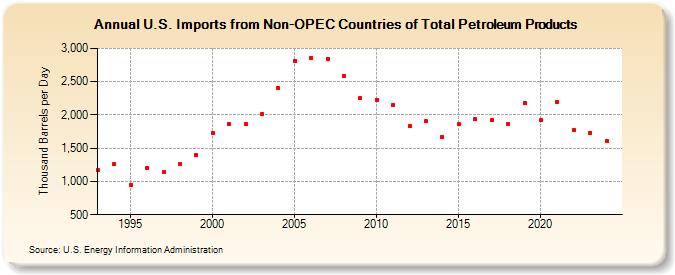
| U.S. Imports from Non-OPEC Countries of Total Petroleum Products (Thousand Barrels per Day) | ||||||||
| Decade | Year-0 | Year-1 | Year-2 | Year-3 | Year-4 | Year-5 | Year-6 | Year-7 | Year-8 | Year-9 |
|---|---|---|---|---|---|---|---|---|---|---|
| 1990's | 1,166 | 1,266 | 944 | 1,197 | 1,143 | 1,266 | 1,397 | |||
| 2000's | 1,730 | 1,863 | 1,868 | 2,015 | 2,399 | 2,816 | 2,856 | 2,845 | 2,592 | 2,257 |
| 2010's | 2,226 | 2,154 | 1,832 | 1,902 | 1,665 | 1,864 | 1,940 | 1,927 | 1,869 | 2,183 |
| 2020's | 1,917 | 2,199 | 1,773 | 1,729 |
| - = No Data Reported; -- = Not Applicable; NA = Not Available; W = Withheld to avoid disclosure of individual company data. |
| Release Date: 6/28/2024 |
| Next Release Date: 8/30/2024 |