|
Download Data (XLS File) |
|
||||||||
|
||||||||
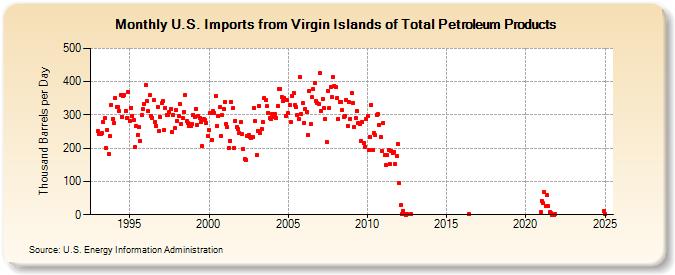
| U.S. Imports from Virgin Islands of Total Petroleum Products (Thousand Barrels per Day) | ||||||||
| Year | Jan | Feb | Mar | Apr | May | Jun | Jul | Aug | Sep | Oct | Nov | Dec |
|---|---|---|---|---|---|---|---|---|---|---|---|---|
| 1993 | 252 | 244 | 244 | 245 | 279 | 290 | 202 | 256 | 184 | 236 | 330 | 288 |
| 1994 | 276 | 351 | 325 | 325 | 312 | 361 | 294 | 356 | 360 | 313 | 292 | 369 |
| 1995 | 283 | 322 | 298 | 284 | 203 | 268 | 240 | 264 | 223 | 299 | 317 | 334 |
| 1996 | 390 | 343 | 311 | 359 | 298 | 292 | 344 | 279 | 268 | 325 | 253 | 294 |
| 1997 | 335 | 341 | 254 | 321 | 300 | 300 | 310 | 319 | 248 | 301 | 260 | 314 |
| 1998 | 283 | 296 | 334 | 272 | 292 | 310 | 360 | 281 | 277 | 268 | 266 | 274 |
| 1999 | 300 | 295 | 319 | 271 | 298 | 290 | 278 | 206 | 288 | 284 | 277 | 236 |
| 2000 | 255 | 306 | 226 | 312 | 307 | 356 | 267 | 297 | 323 | 237 | 299 | 318 |
| 2001 | 339 | 273 | 263 | 201 | 223 | 339 | 320 | 202 | 283 | 263 | 259 | 247 |
| 2002 | 278 | 242 | 198 | 168 | 165 | 236 | 240 | 234 | 231 | 235 | 321 | 281 |
| 2003 | 179 | 253 | 328 | 245 | 258 | 278 | 351 | 345 | 326 | 307 | 291 | 287 |
| 2004 | 302 | 293 | 302 | 290 | 328 | 378 | 379 | 355 | 342 | 352 | 296 | 344 |
| 2005 | 305 | 330 | 278 | 358 | 367 | 331 | 323 | 299 | 289 | 413 | 303 | 335 |
| 2006 | 277 | 318 | 309 | 239 | 373 | 273 | 353 | 377 | 396 | 342 | 337 | 334 |
| 2007 | 425 | 312 | 349 | 322 | 287 | 218 | 372 | 320 | 384 | 353 | 414 | 387 |
| 2008 | 383 | 351 | 289 | 340 | 340 | 314 | 294 | 298 | 345 | 267 | 338 | 289 |
| 2009 | 367 | 337 | 264 | 290 | 313 | 276 | 273 | 223 | 280 | 215 | 205 | 289 |
| 2010 | 298 | 196 | 235 | 331 | 195 | 246 | 239 | 301 | 302 | 270 | 234 | 191 |
| 2011 | 276 | 179 | 149 | 179 | 194 | 151 | 192 | 185 | 189 | 151 | 177 | 214 |
| 2012 | 96 | 28 | 1 | 12 | 2 | 0 | 1 | 3 | ||||
| 2016 | 1 | |||||||||||
| 2020 | 7 | |||||||||||
| 2021 | 42 | 34 | 67 | 26 | 59 | 25 | 7 | 4 | 0 | 0 | 2 | |
| - = No Data Reported; -- = Not Applicable; NA = Not Available; W = Withheld to avoid disclosure of individual company data. |
| Release Date: 3/29/2024 |
| Next Release Date: 4/30/2024 |