|
Download Data (XLS File) |
|
||||||||
|
||||||||
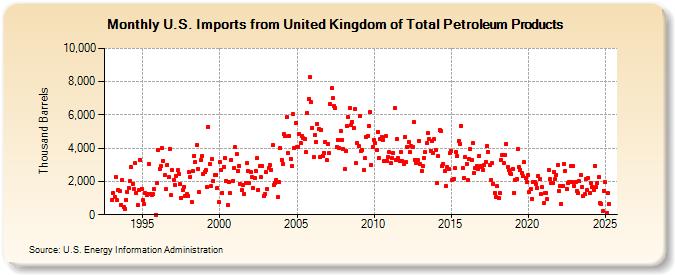
| U.S. Imports from United Kingdom of Total Petroleum Products (Thousand Barrels) | ||||||||
| Year | Jan | Feb | Mar | Apr | May | Jun | Jul | Aug | Sep | Oct | Nov | Dec |
|---|---|---|---|---|---|---|---|---|---|---|---|---|
| 1993 | 882 | 1,292 | 1,064 | 2,271 | 860 | 1,500 | 1,408 | 609 | 2,083 | 470 | 319 | 909 |
| 1994 | 1,392 | 1,623 | 2,002 | 2,842 | 1,831 | 1,570 | 3,102 | 1,278 | 559 | 1,463 | 3,312 | 1,567 |
| 1995 | 861 | 640 | 1,325 | 1,213 | 1,217 | 3,051 | 1,221 | 1,213 | 1,227 | 1,520 | 0 | 1,894 |
| 1996 | 3,916 | 2,742 | 2,901 | 4,026 | 3,251 | 2,360 | 1,524 | 3,009 | 2,242 | 3,969 | 1,179 | 2,664 |
| 1997 | 2,086 | 1,797 | 2,331 | 2,671 | 2,477 | 1,835 | 1,027 | 1,472 | 1,691 | 1,107 | 1,226 | 1,141 |
| 1998 | 2,551 | 2,272 | 772 | 2,613 | 3,560 | 3,167 | 4,172 | 2,774 | 1,355 | 3,286 | 3,501 | 2,472 |
| 1999 | 2,549 | 2,662 | 1,649 | 5,287 | 3,046 | 1,697 | 3,335 | 2,011 | 2,360 | 2,385 | 1,626 | 744 |
| 2000 | 3,175 | 2,665 | 1,335 | 2,888 | 3,424 | 2,013 | 567 | 1,938 | 1,289 | 3,307 | 2,055 | 2,811 |
| 2001 | 4,047 | 3,632 | 2,656 | 2,955 | 1,822 | 1,480 | 1,807 | 1,255 | 1,917 | 3,098 | 2,642 | 1,879 |
| 2002 | 2,546 | 2,252 | 1,593 | 2,218 | 2,648 | 3,405 | 1,505 | 2,925 | 2,242 | 2,958 | 1,111 | 1,216 |
| 2003 | 2,569 | 1,557 | 2,785 | 2,964 | 2,693 | 4,162 | 1,798 | 1,931 | 2,114 | 1,046 | 1,966 | 3,997 |
| 2004 | 3,308 | 3,054 | 4,826 | 4,715 | 5,859 | 3,699 | 4,740 | 3,363 | 2,921 | 6,039 | 4,016 | 5,490 |
| 2005 | 4,045 | 4,101 | 4,860 | 4,287 | 4,759 | 4,592 | 4,555 | 3,753 | 6,124 | 6,968 | 8,262 | 6,747 |
| 2006 | 5,236 | 3,476 | 4,801 | 4,384 | 5,474 | 5,182 | 3,442 | 5,121 | 3,544 | 3,739 | 4,375 | 3,285 |
| 2007 | 4,265 | 3,682 | 6,645 | 7,611 | 6,999 | 6,537 | 6,411 | 4,073 | 4,514 | 4,002 | 5,038 | 4,499 |
| 2008 | 3,968 | 2,746 | 3,827 | 5,317 | 5,863 | 6,398 | 5,368 | 5,595 | 5,195 | 6,350 | 3,086 | 4,301 |
| 2009 | 4,104 | 5,911 | 3,812 | 3,903 | 2,679 | 3,431 | 4,684 | 4,760 | 5,339 | 6,179 | 3,003 | 4,101 |
| 2010 | 4,508 | 4,296 | 3,898 | 4,997 | 3,396 | 4,570 | 4,688 | 4,505 | 3,257 | 4,724 | 3,237 | 3,464 |
| 2011 | 3,767 | 3,086 | 3,399 | 3,725 | 6,410 | 3,299 | 4,566 | 3,384 | 3,212 | 3,782 | 3,222 | 3,048 |
| 2012 | 4,694 | 3,168 | 4,092 | 4,359 | 3,761 | 4,146 | 4,047 | 5,600 | 3,318 | 3,115 | 3,277 | 4,462 |
| 2013 | 3,063 | 2,647 | 2,936 | 3,439 | 3,756 | 4,321 | 4,886 | 4,531 | 3,859 | 4,427 | 3,730 | 4,538 |
| 2014 | 3,882 | 1,908 | 3,544 | 5,103 | 5,016 | 2,912 | 3,072 | 2,612 | 1,720 | 2,865 | 2,770 | 3,681 |
| 2015 | 3,825 | 2,075 | 2,169 | 2,802 | 3,786 | 3,510 | 4,413 | 4,261 | 5,350 | 2,811 | 2,213 | 3,459 |
| 2016 | 3,051 | 2,068 | 3,360 | 3,952 | 3,286 | 4,310 | 2,537 | 2,788 | 2,900 | 2,752 | 3,560 | 2,952 |
| 2017 | 2,845 | 2,690 | 2,967 | 3,176 | 4,134 | 3,790 | 2,962 | 2,071 | 3,095 | 1,858 | 1,332 | 1,061 |
| 2018 | 1,702 | 986 | 1,293 | 3,307 | 3,617 | 3,120 | 3,618 | 4,267 | 2,878 | 2,672 | 2,494 | 2,443 |
| 2019 | 2,757 | 1,324 | 2,114 | 2,165 | 3,933 | 2,842 | 2,710 | 2,526 | 2,324 | 3,144 | 2,213 | 1,996 |
| 2020 | 2,386 | 1,369 | 1,539 | 974 | 1,949 | 1,982 | 1,840 | 1,618 | 2,329 | 2,122 | 1,230 | 1,645 |
| 2021 | 678 | 1,279 | 1,310 | 924 | 2,718 | 2,126 | 1,892 | 1,896 | 2,573 | 2,131 | 2,409 | 2,978 |
| 2022 | 1,439 | 1,731 | 655 | 1,715 | 3,058 | 2,634 | 1,557 | 1,885 | 1,988 | 2,958 | 1,940 | 2,919 |
| 2023 | 1,718 | 1,992 | 1,427 | 1,291 | 2,007 | 2,412 | 1,676 | 1,100 | 1,230 | 2,144 | 1,499 | 2,203 |
| 2024 | 1,309 | 1,909 | 1,664 | 1,494 | 2,925 | 1,682 | 1,885 | 2,255 | 705 | 651 | 206 | 1,445 |
| 2025 | 1,941 | 127 | 1,288 | 662 | ||||||||
| - = No Data Reported; -- = Not Applicable; NA = Not Available; W = Withheld to avoid disclosure of individual company data. |
| Release Date: 6/30/2025 |
| Next Release Date: 7/31/2025 |