|
Download Data (XLS File) |
|
||||||||
|
||||||||
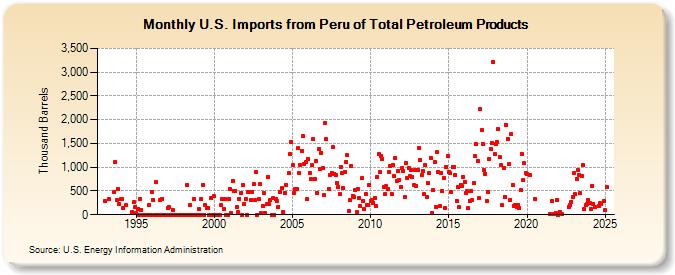
| U.S. Imports from Peru of Total Petroleum Products (Thousand Barrels) | ||||||||
| Year | Jan | Feb | Mar | Apr | May | Jun | Jul | Aug | Sep | Oct | Nov | Dec |
|---|---|---|---|---|---|---|---|---|---|---|---|---|
| 1993 | 299 | 328 | 487 | 1,110 | 311 | 544 | 218 | |||||
| 1994 | 331 | 322 | 150 | 194 | 50 | 258 | 157 | |||||
| 1995 | 35 | 111 | 0 | 334 | 100 | 0 | 0 | 0 | 0 | 0 | 200 | 0 |
| 1996 | 476 | 304 | 0 | 680 | 0 | 0 | 302 | 0 | 332 | 0 | 0 | 0 |
| 1997 | 141 | 160 | 0 | 0 | 100 | 0 | 0 | 0 | 0 | 0 | 0 | 0 |
| 1998 | 0 | 0 | 0 | 620 | 0 | 203 | 0 | 0 | 329 | 0 | 0 | 0 |
| 1999 | 113 | 0 | 332 | 625 | 0 | 200 | 135 | 135 | 0 | 350 | 0 | 0 |
| 2000 | 388 | 0 | 0 | 0 | 0 | 200 | 328 | 125 | 326 | 0 | 0 | 329 |
| 2001 | 549 | 26 | 712 | 507 | 503 | 166 | 51 | 333 | 450 | 0 | 630 | 224 |
| 2002 | 327 | 0 | 478 | 485 | 320 | 468 | 643 | 301 | 889 | 0 | 330 | 637 |
| 2003 | 37 | 182 | 464 | 41 | 220 | 799 | 220 | 301 | 0 | 342 | 0 | 329 |
| 2004 | 280 | 168 | 471 | 552 | 54 | 451 | 632 | 877 | 1,270 | 1,534 | ||
| 2005 | 1,051 | 462 | 532 | 549 | 1,396 | 885 | 1,049 | 1,350 | 1,652 | 1,067 | 1,108 | 322 |
| 2006 | 1,169 | 880 | 745 | 1,048 | 1,587 | 759 | 1,137 | 453 | 1,393 | 952 | 1,304 | 985 |
| 2007 | 418 | 1,936 | 1,593 | 550 | 841 | 884 | 1,422 | 867 | 829 | 664 | 582 | |
| 2008 | 429 | 1,002 | 884 | 556 | 901 | 1,115 | 1,255 | 79 | 312 | 1,024 | 400 | 382 |
| 2009 | 527 | 50 | 546 | 348 | 190 | 767 | 290 | 116 | 431 | 209 | 209 | 629 |
| 2010 | 299 | 310 | 254 | 346 | 176 | 804 | 1,276 | 894 | 1,239 | 1,175 | 588 | 427 |
| 2011 | 597 | 549 | 895 | 1,018 | 444 | 1,051 | 819 | 1,198 | 710 | 921 | 739 | 584 |
| 2012 | 988 | 924 | 370 | 1,085 | 770 | 991 | 817 | 945 | 792 | 624 | 944 | 606 |
| 2013 | 951 | 1,405 | 1,158 | 833 | 928 | 428 | 1,044 | 379 | 675 | 877 | 1,203 | 40 |
| 2014 | 515 | 1,099 | 170 | 1,319 | 907 | 176 | 883 | 496 | 776 | 150 | 1,010 | 1,229 |
| 2015 | 904 | 875 | 472 | 1,006 | 996 | 841 | 290 | 573 | 160 | 634 | 601 | 794 |
| 2016 | 689 | 447 | 492 | 131 | 289 | 490 | 300 | 666 | 1,243 | 1,483 | 1,131 | 349 |
| 2017 | 2,221 | 1,781 | 1,488 | 937 | 867 | 281 | 479 | 1,179 | 1,374 | 1,514 | 3,205 | 1,279 |
| 2018 | 1,483 | 1,520 | 1,800 | 1,210 | 1,047 | 198 | 975 | 383 | 1,896 | 1,601 | 1,061 | 320 |
| 2019 | 1,695 | 631 | 189 | 207 | 160 | 213 | 140 | 511 | 1,283 | 731 | 1,079 | 872 |
| 2020 | 859 | 826 | 326 | |||||||||
| 2021 | 6 | 284 | 20 | 40 | 311 | |||||||
| 2022 | 0 | 67 | 7 | 171 | 200 | 277 | 372 | |||||
| 2023 | 880 | 435 | 751 | 942 | 843 | 450 | 809 | 1,037 | 110 | 201 | 219 | 319 |
| 2024 | 247 | |||||||||||
| - = No Data Reported; -- = Not Applicable; NA = Not Available; W = Withheld to avoid disclosure of individual company data. |
| Release Date: 3/29/2024 |
| Next Release Date: 4/30/2024 |
Referring Pages: