|
Download Data (XLS File) |
|
||||||||
|
||||||||
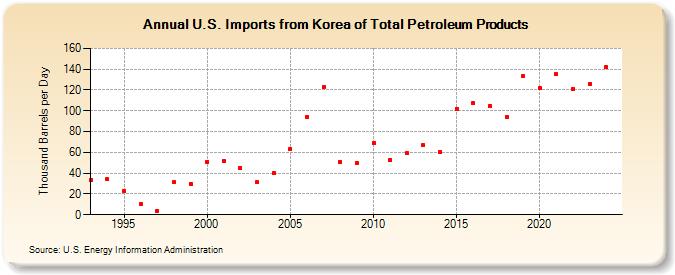
| U.S. Imports from Korea of Total Petroleum Products (Thousand Barrels per Day) | ||||||||
| Decade | Year-0 | Year-1 | Year-2 | Year-3 | Year-4 | Year-5 | Year-6 | Year-7 | Year-8 | Year-9 |
|---|---|---|---|---|---|---|---|---|---|---|
| 1990's | 33 | 34 | 23 | 10 | 4 | 31 | 30 | |||
| 2000's | 51 | 52 | 45 | 31 | 40 | 63 | 94 | 123 | 51 | 50 |
| 2010's | 69 | 53 | 59 | 67 | 60 | 102 | 107 | 105 | 94 | 133 |
| 2020's | 122 | 135 | 121 | 125 |
| - = No Data Reported; -- = Not Applicable; NA = Not Available; W = Withheld to avoid disclosure of individual company data. |
| Release Date: 3/29/2024 |
| Next Release Date: 8/30/2024 |