|
Download Data (XLS File) |
|
||||||||
|
||||||||
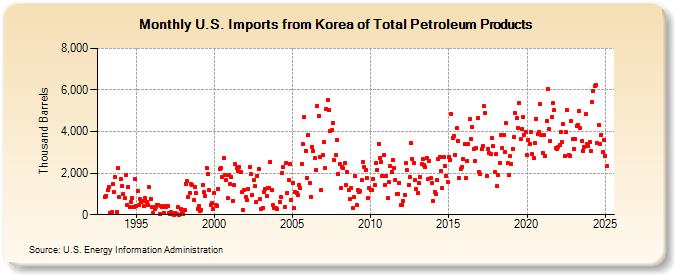
| U.S. Imports from Korea of Total Petroleum Products (Thousand Barrels) | ||||||||
| Year | Jan | Feb | Mar | Apr | May | Jun | Jul | Aug | Sep | Oct | Nov | Dec |
|---|---|---|---|---|---|---|---|---|---|---|---|---|
| 1993 | 832 | 919 | 1,175 | 1,324 | 83 | 112 | 1,454 | 1,100 | 1,801 | 123 | 2,238 | 839 |
| 1994 | 1,706 | 1,376 | 1,019 | 783 | 1,896 | 458 | 1,347 | 385 | 612 | 793 | 379 | 1,721 |
| 1995 | 397 | 1,160 | 452 | 779 | 590 | 655 | 399 | 784 | 605 | 488 | 1,320 | 769 |
| 1996 | 365 | 61 | 290 | 395 | 456 | 466 | 33 | 398 | 361 | 92 | 403 | 388 |
| 1997 | 397 | 76 | 36 | 127 | 42 | 0 | 97 | 16 | 372 | 0 | 273 | 63 |
| 1998 | 37 | 232 | 1,492 | 1,613 | 848 | 1,041 | 1,462 | 1,433 | 691 | 1,312 | 1,048 | 265 |
| 1999 | 438 | 164 | 235 | 1,407 | 1,074 | 911 | 2,264 | 1,952 | 1,169 | 472 | 565 | 252 |
| 2000 | 1,057 | 484 | 440 | 1,237 | 2,195 | 2,264 | 1,825 | 2,722 | 1,916 | 1,666 | 795 | 1,899 |
| 2001 | 1,493 | 1,825 | 673 | 1,429 | 2,426 | 2,243 | 2,105 | 2,294 | 2,054 | 1,075 | 214 | 1,205 |
| 2002 | 873 | 699 | 1,223 | 2,296 | 1,969 | 972 | 1,648 | 1,372 | 627 | 1,886 | 2,209 | 751 |
| 2003 | 295 | 337 | 1,092 | 1,219 | 878 | 1,304 | 1,304 | 2,554 | 1,180 | 445 | 309 | 309 |
| 2004 | 265 | 626 | 837 | 2,005 | 2,301 | 390 | 2,500 | 1,065 | 1,647 | 2,455 | 703 | |
| 2005 | 1,518 | 316 | 1,084 | 1,043 | 962 | 1,414 | 1,268 | 2,445 | 3,396 | 4,706 | 3,080 | 1,769 |
| 2006 | 3,831 | 1,539 | 860 | 3,271 | 3,073 | 2,739 | 2,144 | 5,235 | 4,760 | 2,788 | 1,208 | 2,882 |
| 2007 | 3,487 | 2,243 | 5,085 | 5,521 | 5,022 | 4,023 | 4,072 | 4,416 | 2,616 | 2,857 | 3,574 | 1,973 |
| 2008 | 2,440 | 1,286 | 2,316 | 2,232 | 2,473 | 1,408 | 2,042 | 1,175 | 751 | 1,300 | 300 | 830 |
| 2009 | 1,868 | 463 | 1,174 | 1,077 | 1,129 | 1,651 | 2,546 | 2,292 | 2,149 | 1,753 | 780 | 1,291 |
| 2010 | 1,195 | 1,190 | 1,734 | 1,416 | 2,499 | 2,153 | 3,424 | 2,709 | 2,553 | 1,842 | 2,877 | 1,434 |
| 2011 | 1,842 | 820 | 1,594 | 2,340 | 2,062 | 2,613 | 2,240 | 1,685 | 983 | 999 | 1,548 | 459 |
| 2012 | 468 | 670 | 962 | 2,481 | 2,134 | 1,428 | 1,816 | 3,449 | 2,660 | 2,505 | 1,678 | 1,228 |
| 2013 | 1,037 | 1,524 | 1,828 | 2,452 | 2,659 | 2,388 | 2,302 | 2,746 | 1,703 | 2,586 | 1,743 | 1,536 |
| 2014 | 667 | 1,106 | 1,005 | 1,663 | 2,658 | 2,781 | 2,105 | 1,303 | 2,771 | 2,322 | 1,876 | 1,588 |
| 2015 | 2,786 | 2,648 | 4,840 | 3,680 | 3,793 | 2,892 | 4,151 | 3,549 | 1,754 | 2,201 | 2,306 | 2,658 |
| 2016 | 3,397 | 1,774 | 2,586 | 3,407 | 4,602 | 3,663 | 4,213 | 3,159 | 2,560 | 3,229 | 4,661 | 2,055 |
| 2017 | 1,937 | 3,156 | 3,304 | 5,222 | 4,884 | 1,858 | 3,183 | 2,960 | 2,924 | 3,692 | 3,308 | 2,040 |
| 2018 | 2,921 | 1,360 | 1,903 | 2,505 | 3,827 | 3,225 | 3,842 | 3,038 | 4,408 | 2,491 | 1,927 | 2,817 |
| 2019 | 2,434 | 3,181 | 3,721 | 4,890 | 4,630 | 4,170 | 5,351 | 3,640 | 4,121 | 4,703 | 3,835 | 3,987 |
| 2020 | 2,865 | 3,606 | 3,412 | 4,000 | 2,912 | 2,712 | 3,427 | 4,622 | 3,868 | 4,001 | 5,323 | 3,824 |
| 2021 | 2,988 | 3,855 | 2,826 | 4,524 | 6,047 | 4,106 | 3,538 | 4,701 | 5,388 | 5,029 | 3,187 | 3,173 |
| 2022 | 3,265 | 3,364 | 3,976 | 3,493 | 4,381 | 2,822 | 3,963 | 5,044 | 2,890 | 2,818 | 4,501 | 3,634 |
| 2023 | 3,150 | 3,647 | 4,286 | 4,311 | 5,000 | 4,158 | 3,542 | 3,071 | 3,241 | 4,823 | 3,421 | 3,292 |
| 2024 | 3,520 | 3,066 | 5,426 | 5,969 | 6,171 | 6,263 | 3,435 | 4,307 | 3,421 | 3,854 | 2,999 | 3,613 |
| 2025 | 2,848 | 2,344 | 4,756 | 5,962 | ||||||||
| - = No Data Reported; -- = Not Applicable; NA = Not Available; W = Withheld to avoid disclosure of individual company data. |
| Release Date: 6/30/2025 |
| Next Release Date: 7/31/2025 |