|
Download Data (XLS File) |
|
||||||||
|
||||||||
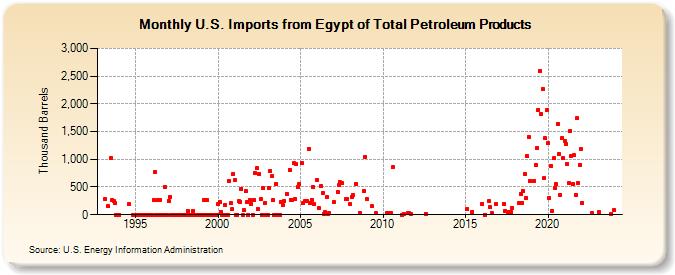
| U.S. Imports from Egypt of Total Petroleum Products (Thousand Barrels) | ||||||||
| Year | Jan | Feb | Mar | Apr | May | Jun | Jul | Aug | Sep | Oct | Nov | Dec |
|---|---|---|---|---|---|---|---|---|---|---|---|---|
| 1993 | 284 | 152 | 1,019 | 267 | 241 | 205 | 1 | 1 | ||||
| 1994 | 1 | 186 | 1 | |||||||||
| 1995 | 0 | 0 | 0 | 1 | 0 | 1 | 0 | 0 | 0 | 0 | 0 | 0 |
| 1996 | 0 | 257 | 778 | 0 | 266 | 0 | 265 | 0 | 0 | 505 | 0 | 0 |
| 1997 | 255 | 328 | 0 | 0 | 0 | 0 | 0 | 0 | 0 | 0 | 0 | 0 |
| 1998 | 0 | 0 | 58 | 0 | 0 | 0 | 70 | 0 | 0 | 0 | 0 | 0 |
| 1999 | 0 | 0 | 264 | 0 | 267 | 0 | 0 | 0 | 0 | 0 | 1 | 1 |
| 2000 | 202 | 238 | 52 | 0 | 0 | 180 | 0 | 0 | 610 | 205 | 96 | 730 |
| 2001 | 621 | 0 | 0 | 240 | 232 | 469 | 0 | 79 | 422 | 221 | 0 | 268 |
| 2002 | 199 | 0 | 271 | 753 | 835 | 103 | 730 | 278 | 0 | 485 | 213 | 0 |
| 2003 | 0 | 490 | 792 | 693 | 257 | 0 | 557 | 0 | 0 | 0 | 236 | 168 |
| 2004 | 247 | 382 | 812 | 273 | 263 | 929 | 277 | 908 | 502 | 554 | ||
| 2005 | 934 | 205 | 239 | 243 | 1,194 | 211 | 267 | 500 | 186 | |||
| 2006 | 627 | 115 | 511 | 393 | 7 | 43 | 318 | 10 | 23 | |||
| 2007 | 230 | 416 | 529 | 582 | 574 | 278 | 278 | |||||
| 2008 | 193 | 321 | 357 | 562 | 36 | 436 | 1,050 | |||||
| 2009 | 281 | 151 | 22 | |||||||||
| 2010 | 22 | 22 | 22 | 853 | ||||||||
| 2011 | 1 | 14 | 23 | 26 | 9 | |||||||
| 2012 | 18 | |||||||||||
| 2015 | 96 | 56 | ||||||||||
| 2016 | 199 | 1 | 245 | 133 | 24 | 190 | ||||||
| 2017 | 193 | 66 | 46 | 50 | 125 | |||||||
| 2018 | 204 | 374 | 216 | 426 | 726 | 304 | 1,052 | 1,405 | 613 | |||
| 2019 | 611 | 894 | 1,200 | 1,896 | 2,591 | 1,815 | 2,266 | 654 | 1,378 | 1,880 | ||
| 2020 | 1,287 | 303 | 886 | 76 | 1,018 | 482 | 547 | 1,643 | 1,096 | 357 | 1,378 | 1,027 |
| 2021 | 1,330 | 1,269 | 912 | 571 | 1,512 | 1,066 | 546 | 1,069 | 361 | 1,737 | 570 | 903 |
| 2022 | 1,178 | 215 | 22 | |||||||||
| 2023 | 47 | 20 | ||||||||||
| 2024 | 82 | |||||||||||
| - = No Data Reported; -- = Not Applicable; NA = Not Available; W = Withheld to avoid disclosure of individual company data. |
| Release Date: 3/29/2024 |
| Next Release Date: 4/30/2024 |
Referring Pages: