|
Download Data (XLS File) |
|
||||||||
|
||||||||
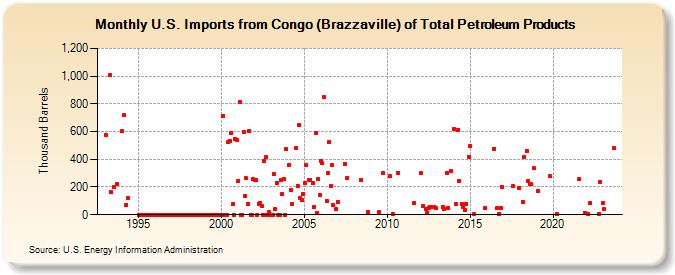
| U.S. Imports from Congo (Brazzaville) of Total Petroleum Products (Thousand Barrels) | ||||||||
| Year | Jan | Feb | Mar | Apr | May | Jun | Jul | Aug | Sep | Oct | Nov | Dec |
|---|---|---|---|---|---|---|---|---|---|---|---|---|
| 1993 | 575 | 1,009 | 163 | 201 | 222 | |||||||
| 1994 | 601 | 717 | 71 | 120 | ||||||||
| 1995 | 0 | 0 | 0 | 0 | 0 | 0 | 0 | 0 | 0 | 0 | 0 | 0 |
| 1996 | 0 | 0 | 0 | 0 | 0 | 0 | 0 | 0 | 0 | 0 | 0 | 0 |
| 1997 | 0 | 0 | 0 | 0 | 0 | 0 | 0 | 0 | 0 | 0 | 0 | 0 |
| 1998 | 0 | 0 | 0 | 0 | 0 | 0 | 0 | 0 | 0 | 0 | 0 | 0 |
| 1999 | 0 | 0 | 0 | 0 | 0 | 0 | 0 | 0 | 0 | 0 | 0 | 0 |
| 2000 | 0 | 715 | 0 | 0 | 0 | 528 | 534 | 591 | 75 | 0 | 545 | 540 |
| 2001 | 243 | 815 | 0 | 0 | 600 | 137 | 263 | 80 | 606 | 0 | 0 | 256 |
| 2002 | 253 | 250 | 0 | 79 | 85 | 63 | 0 | 385 | 413 | 0 | 22 | 0 |
| 2003 | 0 | 0 | 296 | 41 | 232 | 0 | 0 | 253 | 151 | 256 | 0 | 471 |
| 2004 | 361 | 180 | 75 | 483 | 209 | 646 | 121 | 104 | 149 | |||
| 2005 | 230 | 357 | 251 | 251 | 228 | 56 | 588 | 11 | 259 | 145 | ||
| 2006 | 389 | 373 | 847 | 100 | 298 | 526 | 208 | 356 | 67 | 40 | ||
| 2007 | 94 | 367 | 265 | |||||||||
| 2008 | 249 | 21 | ||||||||||
| 2009 | 17 | 299 | ||||||||||
| 2010 | 277 | 2 | 303 | |||||||||
| 2011 | 83 | |||||||||||
| 2012 | 299 | 61 | 44 | 15 | 52 | 58 | 54 | 48 | ||||
| 2013 | 57 | 39 | 302 | 49 | 314 | |||||||
| 2014 | 617 | 77 | 610 | 243 | 77 | 55 | 37 | 76 | 420 | |||
| 2015 | 496 | 4 | 50 | |||||||||
| 2016 | 477 | 45 | 7 | 49 | 200 | |||||||
| 2017 | 205 | 196 | ||||||||||
| 2018 | 95 | 415 | 461 | 243 | 220 | 223 | 337 | |||||
| 2019 | 173 | 276 | ||||||||||
| 2020 | 4 | |||||||||||
| 2021 | 256 | 15 | ||||||||||
| 2022 | 8 | 84 | 7 | 237 | ||||||||
| 2023 | 88 | 38 | 479 | |||||||||
| - = No Data Reported; -- = Not Applicable; NA = Not Available; W = Withheld to avoid disclosure of individual company data. |
| Release Date: 8/30/2024 |
| Next Release Date: 9/30/2024 |