|
Download Data (XLS File) |
|
||||||||
|
||||||||
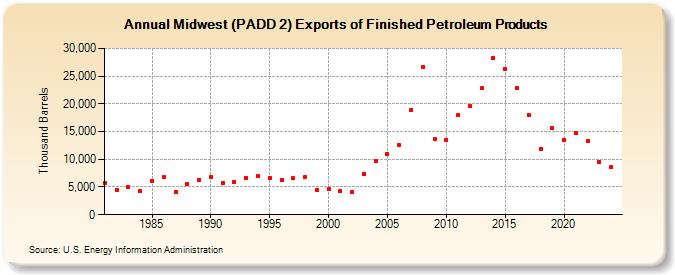
| Midwest (PADD 2) Exports of Finished Petroleum Products (Thousand Barrels) | ||||||||
| Decade | Year-0 | Year-1 | Year-2 | Year-3 | Year-4 | Year-5 | Year-6 | Year-7 | Year-8 | Year-9 |
|---|---|---|---|---|---|---|---|---|---|---|
| 1980's | 5,758 | 4,510 | 4,961 | 4,338 | 6,152 | 6,792 | 4,133 | 5,494 | 6,340 | |
| 1990's | 6,754 | 5,673 | 5,970 | 6,712 | 6,992 | 6,599 | 6,223 | 6,533 | 6,812 | 4,454 |
| 2000's | 4,593 | 4,330 | 4,087 | 7,362 | 9,642 | 10,974 | 12,496 | 18,893 | 26,600 | 13,685 |
| 2010's | 13,562 | 17,961 | 19,536 | 22,766 | 28,327 | 26,295 | 22,777 | 18,059 | 11,856 | 15,564 |
| 2020's | 13,552 | 14,689 | 13,267 | 9,497 |
| - = No Data Reported; -- = Not Applicable; NA = Not Available; W = Withheld to avoid disclosure of individual company data. |
| Release Date: 6/28/2024 |
| Next Release Date: 8/30/2024 |