|
Download Data (XLS File) |
|
||||||||
|
||||||||
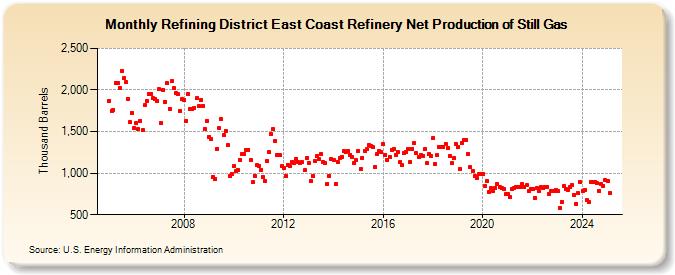
| Refining District East Coast Refinery Net Production of Still Gas (Thousand Barrels) | ||||||||
| Year | Jan | Feb | Mar | Apr | May | Jun | Jul | Aug | Sep | Oct | Nov | Dec |
|---|---|---|---|---|---|---|---|---|---|---|---|---|
| 2005 | 1,873 | 1,751 | 1,761 | 2,081 | 2,082 | 2,025 | 2,234 | 2,140 | 2,092 | 1,895 | 1,610 | 1,729 |
| 2006 | 1,546 | 1,604 | 1,525 | 1,630 | 1,518 | 1,816 | 1,873 | 1,957 | 1,956 | 1,898 | 1,891 | 1,871 |
| 2007 | 2,007 | 1,600 | 2,003 | 1,861 | 2,079 | 1,773 | 2,108 | 2,021 | 1,959 | 1,953 | 1,743 | 1,893 |
| 2008 | 1,880 | 1,629 | 1,957 | 1,773 | 1,768 | 1,788 | 1,899 | 1,802 | 1,876 | 1,808 | 1,530 | 1,632 |
| 2009 | 1,440 | 1,413 | 956 | 931 | 1,295 | 1,538 | 1,647 | 1,454 | 1,508 | 1,333 | 963 | 989 |
| 2010 | 1,081 | 1,026 | 1,039 | 1,161 | 1,227 | 1,236 | 1,283 | 1,284 | 1,158 | 893 | 967 | 1,094 |
| 2011 | 1,089 | 1,041 | 954 | 907 | 1,143 | 1,251 | 1,473 | 1,527 | 1,389 | 1,223 | 1,215 | 1,082 |
| 2012 | 1,067 | 966 | 1,100 | 1,086 | 1,137 | 1,127 | 1,174 | 1,132 | 1,124 | 1,128 | 1,034 | 1,184 |
| 2013 | 1,126 | 904 | 968 | 1,142 | 1,205 | 1,169 | 1,231 | 1,135 | 1,117 | 874 | 965 | 1,169 |
| 2014 | 1,158 | 875 | 1,138 | 1,180 | 1,199 | 1,262 | 1,253 | 1,270 | 1,222 | 1,200 | 1,122 | 1,156 |
| 2015 | 1,269 | 1,048 | 1,187 | 1,270 | 1,287 | 1,341 | 1,331 | 1,314 | 1,076 | 1,229 | 1,261 | 1,249 |
| 2016 | 1,350 | 1,223 | 1,154 | 1,194 | 1,280 | 1,286 | 1,221 | 1,255 | 1,128 | 1,094 | 1,237 | 1,253 |
| 2017 | 1,291 | 1,134 | 1,293 | 1,360 | 1,237 | 1,192 | 1,218 | 1,211 | 1,287 | 1,121 | 1,230 | 1,202 |
| 2018 | 1,420 | 1,108 | 1,217 | 1,318 | 1,318 | 1,319 | 1,355 | 1,303 | 1,211 | 1,116 | 1,179 | 1,356 |
| 2019 | 1,313 | 1,051 | 1,361 | 1,394 | 1,395 | 1,235 | 1,070 | 1,026 | 961 | 936 | 984 | 994 |
| 2020 | 992 | 844 | 903 | 770 | 816 | 790 | 826 | 869 | 832 | 819 | 807 | 744 |
| 2021 | 747 | 709 | 815 | 820 | 839 | 839 | 837 | 868 | 828 | 853 | 791 | 812 |
| 2022 | 813 | 705 | 818 | 783 | 836 | 818 | 837 | 832 | 754 | 791 | 784 | 796 |
| 2023 | 786 | 580 | 658 | 1,037 | 1,012 | 877 | 828 | 857 | 742 | 632 | 757 | 889 |
| 2024 | 790 | 799 | 671 | 649 | ||||||||
| - = No Data Reported; -- = Not Applicable; NA = Not Available; W = Withheld to avoid disclosure of individual company data. |
| Release Date: 6/28/2024 |
| Next Release Date: 7/31/2024 |
Referring Pages: