|
Download Data (XLS File) |
|
||||||||
|
||||||||
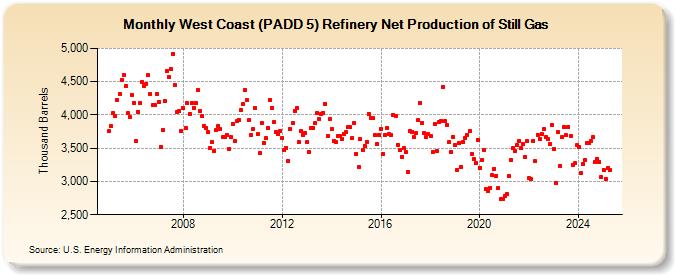
| West Coast (PADD 5) Refinery Net Production of Still Gas (Thousand Barrels) | ||||||||
| Year | Jan | Feb | Mar | Apr | May | Jun | Jul | Aug | Sep | Oct | Nov | Dec |
|---|---|---|---|---|---|---|---|---|---|---|---|---|
| 2005 | 3,757 | 3,831 | 4,032 | 3,989 | 4,225 | 4,312 | 4,528 | 4,604 | 4,431 | 4,027 | 3,972 | 4,302 |
| 2006 | 4,180 | 3,612 | 4,047 | 4,173 | 4,492 | 4,441 | 4,471 | 4,593 | 4,318 | 4,146 | 4,144 | 4,312 |
| 2007 | 4,197 | 3,518 | 3,773 | 4,206 | 4,667 | 4,574 | 4,690 | 4,912 | 4,452 | 4,048 | 4,057 | 3,758 |
| 2008 | 4,100 | 3,807 | 4,174 | 4,017 | 4,172 | 4,111 | 4,174 | 4,379 | 4,055 | 3,979 | 3,830 | 3,803 |
| 2009 | 3,736 | 3,507 | 3,589 | 3,461 | 3,770 | 3,833 | 3,787 | 3,661 | 3,661 | 3,699 | 3,491 | 3,666 |
| 2010 | 3,871 | 3,603 | 3,903 | 3,926 | 4,071 | 4,161 | 4,376 | 4,217 | 3,921 | 3,701 | 3,782 | 4,103 |
| 2011 | 3,714 | 3,424 | 3,879 | 3,578 | 3,648 | 3,807 | 4,229 | 4,104 | 3,899 | 3,743 | 3,709 | 3,763 |
| 2012 | 3,655 | 3,475 | 3,508 | 3,309 | 3,789 | 3,875 | 4,064 | 4,102 | 3,600 | 3,756 | 3,701 | 3,735 |
| 2013 | 3,595 | 3,439 | 3,798 | 3,810 | 3,876 | 4,029 | 3,944 | 4,021 | 4,033 | 4,170 | 3,685 | 3,935 |
| 2014 | 3,790 | 3,611 | 3,596 | 3,681 | 3,679 | 3,635 | 3,719 | 3,739 | 3,820 | 3,814 | 3,650 | 3,884 |
| 2015 | 3,417 | 3,216 | 3,637 | 3,473 | 3,533 | 3,599 | 4,019 | 3,951 | 3,948 | 3,691 | 3,558 | 3,691 |
| 2016 | 3,785 | 3,415 | 3,705 | 3,808 | 3,713 | 3,704 | 4,006 | 3,991 | 3,553 | 3,466 | 3,372 | 3,504 |
| 2017 | 3,440 | 3,144 | 3,756 | 3,749 | 3,667 | 3,726 | 3,920 | 4,183 | 3,884 | 3,735 | 3,675 | 3,720 |
| 2018 | 3,681 | 3,446 | 3,860 | 3,465 | 3,891 | 3,915 | 4,424 | 3,905 | 3,842 | 3,587 | 3,449 | 3,672 |
| 2019 | 3,549 | 3,176 | 3,575 | 3,221 | 3,586 | 3,651 | 3,704 | 3,754 | 3,416 | 3,332 | 3,271 | 3,623 |
| 2020 | 3,207 | 3,327 | 3,480 | 2,884 | 2,851 | 2,908 | 3,093 | 3,193 | 3,084 | 2,895 | 2,729 | 2,733 |
| 2021 | 2,777 | 2,806 | 3,076 | 3,325 | 3,496 | 3,458 | 3,544 | 3,608 | 3,502 | 3,559 | 3,372 | 3,603 |
| 2022 | 3,046 | 3,032 | 3,613 | 3,300 | 3,704 | 3,638 | 3,713 | 3,782 | 3,662 | 3,631 | 3,565 | 3,853 |
| 2023 | 3,487 | 2,976 | 3,739 | 3,237 | 3,666 | 3,816 | 3,693 | 3,819 | 3,685 | 3,254 | 3,272 | 3,542 |
| 2024 | 3,521 | |||||||||||
| - = No Data Reported; -- = Not Applicable; NA = Not Available; W = Withheld to avoid disclosure of individual company data. |
| Release Date: 3/29/2024 |
| Next Release Date: 4/30/2024 |
Referring Pages: