|
Download Data (XLS File) |
|
||||||||
|
||||||||
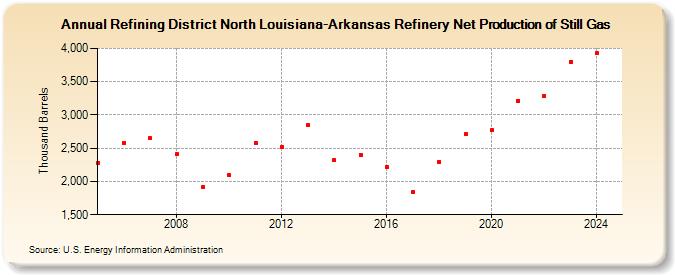
| Refining District North Louisiana-Arkansas Refinery Net Production of Still Gas (Thousand Barrels) | ||||||||
| Decade | Year-0 | Year-1 | Year-2 | Year-3 | Year-4 | Year-5 | Year-6 | Year-7 | Year-8 | Year-9 |
|---|---|---|---|---|---|---|---|---|---|---|
| 2000's | 2,281 | 2,585 | 2,646 | 2,411 | 1,923 | |||||
| 2010's | 2,093 | 2,582 | 2,523 | 2,844 | 2,319 | 2,405 | 2,222 | 1,843 | 2,294 | 2,710 |
| 2020's | 2,773 | 3,215 | 3,286 | 3,802 |
| - = No Data Reported; -- = Not Applicable; NA = Not Available; W = Withheld to avoid disclosure of individual company data. |
| Release Date: 3/29/2024 |
| Next Release Date: 8/30/2024 |