|
Download Data (XLS File) |
|
||||||||
|
||||||||
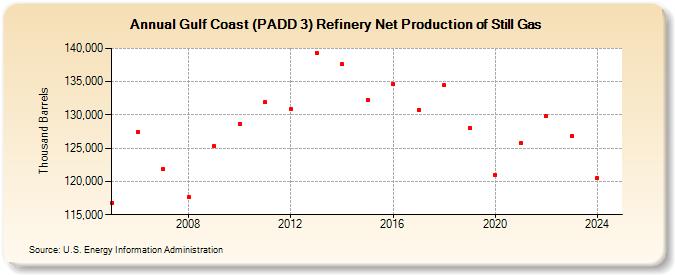
| Gulf Coast (PADD 3) Refinery Net Production of Still Gas (Thousand Barrels) | ||||||||
| Decade | Year-0 | Year-1 | Year-2 | Year-3 | Year-4 | Year-5 | Year-6 | Year-7 | Year-8 | Year-9 |
|---|---|---|---|---|---|---|---|---|---|---|
| 2000's | 116,799 | 127,445 | 121,812 | 117,639 | 125,277 | |||||
| 2010's | 128,679 | 131,873 | 130,824 | 139,312 | 137,596 | 132,264 | 134,657 | 130,710 | 134,434 | 128,076 |
| 2020's | 121,022 | 125,781 | 129,841 | 126,754 |
| - = No Data Reported; -- = Not Applicable; NA = Not Available; W = Withheld to avoid disclosure of individual company data. |
| Release Date: 3/29/2024 |
| Next Release Date: 8/30/2024 |
Referring Pages: