|
Download Data (XLS File) |
|
||||||||
|
||||||||
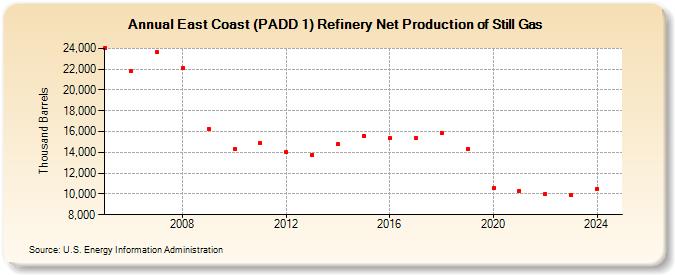
| East Coast (PADD 1) Refinery Net Production of Still Gas (Thousand Barrels) | ||||||||
| Decade | Year-0 | Year-1 | Year-2 | Year-3 | Year-4 | Year-5 | Year-6 | Year-7 | Year-8 | Year-9 |
|---|---|---|---|---|---|---|---|---|---|---|
| 2000's | 23,993 | 21,778 | 23,673 | 22,143 | 16,277 | |||||
| 2010's | 14,281 | 14,915 | 14,008 | 13,782 | 14,768 | 15,605 | 15,347 | 15,413 | 15,824 | 14,328 |
| 2020's | 10,547 | 10,308 | 10,006 | 10,329 |
| - = No Data Reported; -- = Not Applicable; NA = Not Available; W = Withheld to avoid disclosure of individual company data. |
| Release Date: 3/29/2024 |
| Next Release Date: 8/30/2024 |
Referring Pages: