|
Download Data (XLS File) |
|
||||||||
|
||||||||
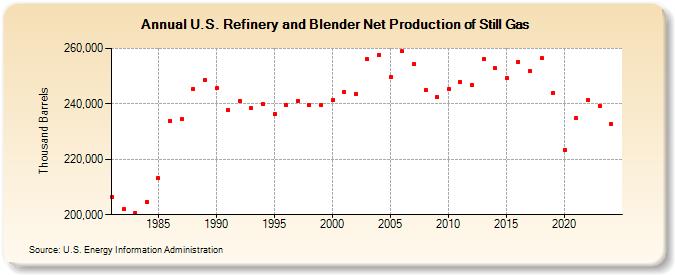
| U.S. Refinery and Blender Net Production of Still Gas (Thousand Barrels) | ||||||||
| Decade | Year-0 | Year-1 | Year-2 | Year-3 | Year-4 | Year-5 | Year-6 | Year-7 | Year-8 | Year-9 |
|---|---|---|---|---|---|---|---|---|---|---|
| 1980's | 206,399 | 202,147 | 200,707 | 204,713 | 213,181 | 233,966 | 234,529 | 245,351 | 248,658 | |
| 1990's | 245,535 | 237,759 | 241,160 | 238,365 | 239,901 | 236,242 | 239,515 | 241,184 | 239,539 | 239,520 |
| 2000's | 241,365 | 244,432 | 243,517 | 256,051 | 257,689 | 249,514 | 258,893 | 254,476 | 245,050 | 242,503 |
| 2010's | 245,302 | 247,829 | 246,803 | 256,216 | 252,824 | 249,171 | 255,241 | 251,761 | 256,427 | 243,912 |
| 2020's | 223,443 | 234,807 | 241,363 | 239,386 | 232,795 |
| - = No Data Reported; -- = Not Applicable; NA = Not Available; W = Withheld to avoid disclosure of individual company data. |
| Release Date: 6/30/2025 |
| Next Release Date: 8/29/2025 |