|
Download Data (XLS File) |
|
||||||||
|
||||||||
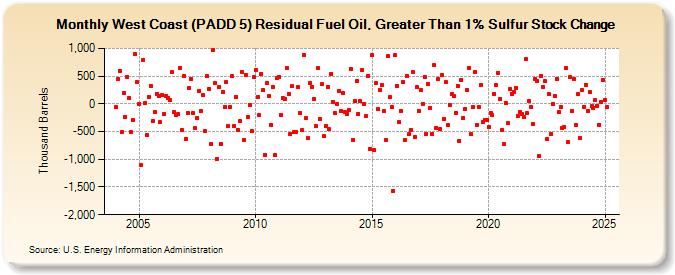
| West Coast (PADD 5) Residual Fuel Oil, Greater Than 1% Sulfur Stock Change (Thousand Barrels) | ||||||||
| Year | Jan | Feb | Mar | Apr | May | Jun | Jul | Aug | Sep | Oct | Nov | Dec |
|---|---|---|---|---|---|---|---|---|---|---|---|---|
| 2004 | -59 | 442 | 600 | -514 | 201 | -240 | 488 | 102 | -510 | -293 | 901 | 389 |
| 2005 | 4 | -1,110 | 796 | 6 | -556 | 126 | 328 | -318 | -145 | 186 | 146 | -334 |
| 2006 | 162 | -179 | 140 | 110 | 73 | 568 | -150 | -210 | -190 | 649 | -469 | 497 |
| 2007 | -630 | -169 | 287 | 448 | -174 | -443 | -260 | 231 | -136 | 151 | -498 | 496 |
| 2008 | 265 | -719 | 965 | 378 | -991 | 295 | -717 | 205 | -65 | 391 | -407 | -59 |
| 2009 | 496 | -394 | 132 | -469 | -315 | 582 | -650 | 527 | -229 | -25 | -496 | 488 |
| 2010 | 613 | 119 | -203 | 539 | 249 | -918 | 375 | 137 | -382 | 301 | -924 | 464 |
| 2011 | 485 | -201 | 106 | 91 | 645 | 186 | -537 | 313 | -513 | -515 | 296 | -158 |
| 2012 | -481 | 880 | -252 | -624 | 370 | 307 | 92 | -400 | 646 | -279 | 354 | -586 |
| 2013 | -396 | 304 | -461 | 546 | 40 | -169 | -3 | 233 | -125 | 190 | -143 | -181 |
| 2014 | -114 | 626 | -644 | 46 | 406 | -178 | 49 | 610 | 3 | -226 | 510 | -808 |
| 2015 | 874 | -837 | 375 | -91 | 253 | 344 | -130 | -645 | 858 | 117 | -52 | -1,578 |
| 2016 | 876 | 320 | -328 | -137 | 387 | -644 | 499 | -549 | -464 | 566 | -592 | 299 |
| 2017 | -124 | 242 | 3 | 486 | -536 | 358 | -67 | -540 | 692 | -431 | 442 | -461 |
| 2018 | 514 | -269 | 389 | -382 | -13 | 169 | 135 | -162 | 329 | -662 | 426 | -252 |
| 2019 | -97 | 252 | 648 | -553 | -49 | 580 | -383 | -62 | 341 | -322 | -289 | -291 |
| 2020 | -421 | -160 | -209 | 181 | 339 | 563 | 93 | -464 | -726 | 9 | -353 | 259 |
| 2021 | 174 | 217 | 284 | -216 | -139 | -188 | -229 | 802 | -174 | 50 | -63 | -357 |
| 2022 | 444 | 403 | -944 | 503 | 304 | 405 | -630 | 180 | -544 | -7 | 140 | 455 |
| 2023 | -146 | -62 | -441 | -416 | 646 | -690 | 477 | -131 | 447 | -377 | 169 | -612 |
| 2024 | 251 | -49 | 340 | -136 | 211 | -45 | ||||||
| - = No Data Reported; -- = Not Applicable; NA = Not Available; W = Withheld to avoid disclosure of individual company data. |
| Release Date: 8/30/2024 |
| Next Release Date: 9/30/2024 |