|
Download Data (XLS File) |
|
||||||||
|
||||||||
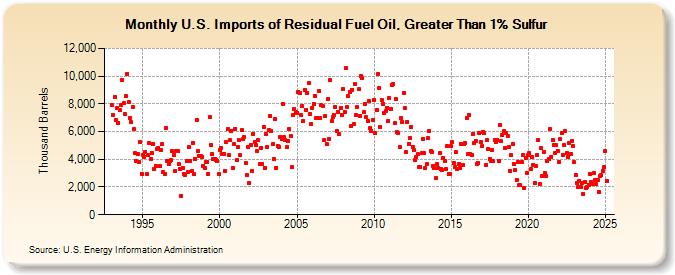
| U.S. Imports of Residual Fuel Oil, Greater Than 1% Sulfur (Thousand Barrels) | ||||||||
| Year | Jan | Feb | Mar | Apr | May | Jun | Jul | Aug | Sep | Oct | Nov | Dec |
|---|---|---|---|---|---|---|---|---|---|---|---|---|
| 1993 | 7,891 | 7,181 | 8,484 | 6,808 | 7,681 | 6,650 | 7,535 | 7,880 | 9,745 | 8,071 | 7,236 | 8,550 |
| 1994 | 10,181 | 8,137 | 6,960 | 6,654 | 7,800 | 6,153 | 4,418 | 3,888 | 4,363 | 3,825 | 5,221 | 2,966 |
| 1995 | 4,334 | 4,200 | 4,540 | 2,904 | 4,276 | 5,170 | 4,019 | 4,483 | 5,111 | 3,280 | 3,548 | 4,721 |
| 1996 | 4,842 | 3,502 | 4,645 | 5,098 | 3,077 | 2,935 | 6,280 | 3,878 | 3,624 | 3,909 | 3,928 | 4,581 |
| 1997 | 4,285 | 3,138 | 4,597 | 4,593 | 3,656 | 3,299 | 1,382 | 3,351 | 2,943 | 2,882 | 3,878 | 3,100 |
| 1998 | 4,901 | 3,900 | 3,128 | 5,199 | 2,908 | 4,017 | 6,819 | 4,594 | 4,255 | 4,258 | 4,161 | 3,528 |
| 1999 | 3,395 | 3,787 | 3,832 | 2,952 | 7,020 | 5,027 | 4,356 | 4,020 | 4,043 | 3,973 | 3,894 | 2,971 |
| 2000 | 4,656 | 4,829 | 4,373 | 4,399 | 3,180 | 5,230 | 6,166 | 4,305 | 5,356 | 6,072 | 3,402 | 5,097 |
| 2001 | 6,213 | 3,924 | 4,869 | 5,384 | 4,287 | 6,082 | 5,495 | 5,588 | 3,753 | 2,899 | 4,915 | 2,304 |
| 2002 | 5,015 | 3,154 | 5,834 | 5,250 | 5,007 | 4,602 | 5,389 | 3,643 | 4,837 | 3,689 | 6,336 | 3,388 |
| 2003 | 5,835 | 4,898 | 6,093 | 7,132 | 6,053 | 5,074 | 4,006 | 6,910 | 3,406 | 4,961 | 4,907 | 5,618 |
| 2004 | 5,468 | 8,016 | 5,579 | 5,363 | 4,865 | 5,319 | 6,182 | 5,670 | 3,422 | 7,196 | 7,596 | 7,438 |
| 2005 | 7,351 | 8,888 | 8,784 | 7,185 | 7,858 | 6,746 | 9,027 | 7,570 | 8,810 | 9,518 | 7,300 | 6,561 |
| 2006 | 7,732 | 7,974 | 8,601 | 6,971 | 7,007 | 8,937 | 6,984 | 7,887 | 7,816 | 5,357 | 7,133 | 5,081 |
| 2007 | 8,357 | 5,474 | 9,698 | 6,754 | 7,075 | 7,212 | 7,781 | 6,013 | 7,444 | 5,813 | 7,709 | 7,229 |
| 2008 | 9,092 | 7,440 | 10,566 | 7,770 | 8,536 | 8,838 | 6,398 | 9,034 | 6,542 | 9,451 | 7,205 | 7,761 |
| 2009 | 9,065 | 7,157 | 9,999 | 9,878 | 7,378 | 7,973 | 7,028 | 6,794 | 8,180 | 6,278 | 6,061 | 6,851 |
| 2010 | 8,267 | 5,874 | 7,536 | 10,120 | 9,145 | 6,364 | 8,262 | 8,007 | 7,360 | 7,469 | 7,730 | 6,763 |
| 2011 | 8,391 | 7,635 | 9,391 | 9,435 | 6,585 | 8,342 | 5,951 | 5,896 | 4,850 | 6,978 | 6,719 | 8,803 |
| 2012 | 7,665 | 4,495 | 6,721 | 5,121 | 5,543 | 6,360 | 4,898 | 4,647 | 3,965 | 4,175 | 4,358 | 3,408 |
| 2013 | 3,478 | 4,426 | 5,451 | 4,450 | 3,361 | 3,627 | 5,511 | 6,027 | 4,629 | 4,545 | 3,550 | 3,355 |
| 2014 | 2,664 | 3,649 | 3,347 | 4,446 | 3,323 | 3,191 | 4,115 | 3,894 | 3,282 | 4,922 | 2,945 | 2,944 |
| 2015 | 4,922 | 5,229 | 3,737 | 3,464 | 4,489 | 3,319 | 3,682 | 3,376 | 5,128 | 3,585 | 5,120 | 5,161 |
| 2016 | 6,981 | 4,365 | 7,192 | 4,378 | 4,275 | 5,831 | 5,156 | 5,351 | 3,688 | 3,724 | 5,864 | 5,248 |
| 2017 | 4,936 | 5,971 | 5,881 | 3,602 | 5,375 | 4,743 | 4,045 | 3,893 | 4,700 | 3,855 | 5,385 | 5,222 |
| 2018 | 5,380 | 3,850 | 6,455 | 5,283 | 5,738 | 6,017 | 4,814 | 5,897 | 5,670 | 4,867 | 3,156 | 4,287 |
| 2019 | 5,110 | 3,659 | 3,212 | 2,524 | 3,809 | 2,159 | 2,128 | 3,836 | 4,326 | 1,954 | 4,099 | 3,037 |
| 2020 | 4,283 | 4,430 | 3,279 | 4,138 | 3,621 | 2,300 | 3,498 | 4,318 | 5,425 | 2,210 | 4,782 | 2,797 |
| 2021 | 4,534 | 3,001 | 2,785 | 3,842 | 4,031 | 6,161 | 4,185 | 5,402 | 5,030 | 4,434 | 5,008 | 4,627 |
| 2022 | 3,811 | 5,485 | 5,877 | 4,344 | 5,004 | 6,017 | 4,464 | 4,146 | 5,210 | 4,415 | 5,312 | 4,972 |
| 2023 | 3,782 | 2,871 | 2,316 | 1,733 | 2,462 | 2,025 | 2,278 | 1,503 | 2,373 | 1,882 | 1,986 | 2,175 |
| 2024 | 2,958 | |||||||||||
| - = No Data Reported; -- = Not Applicable; NA = Not Available; W = Withheld to avoid disclosure of individual company data. |
| Release Date: 3/29/2024 |
| Next Release Date: 4/30/2024 |