|
Download Data (XLS File) |
|
||||||||
|
||||||||
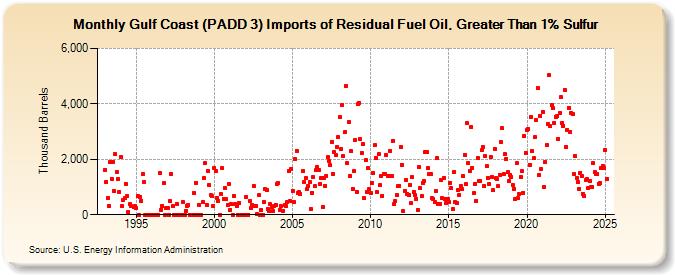
| Gulf Coast (PADD 3) Imports of Residual Fuel Oil, Greater Than 1% Sulfur (Thousand Barrels) | ||||||||
| Year | Jan | Feb | Mar | Apr | May | Jun | Jul | Aug | Sep | Oct | Nov | Dec |
|---|---|---|---|---|---|---|---|---|---|---|---|---|
| 1993 | 1,630 | 1,176 | 609 | 317 | 1,910 | 1,306 | 1,905 | 849 | 2,177 | 1,538 | 1,303 | 827 |
| 1994 | 2,088 | 316 | 548 | 591 | 1,121 | 671 | 106 | 389 | 314 | 296 | 322 | |
| 1995 | 249 | 665 | 0 | 649 | 512 | 1,470 | 1,195 | 0 | 0 | 0 | 0 | 0 |
| 1996 | 0 | 0 | 0 | 0 | 0 | 0 | 1,508 | 181 | 332 | 1,131 | 0 | 240 |
| 1997 | 228 | 0 | 478 | 1,482 | 312 | 0 | 0 | 399 | 0 | 0 | 0 | 0 |
| 1998 | 443 | 0 | 150 | 310 | 358 | 0 | 0 | 0 | 785 | 0 | 1,160 | 0 |
| 1999 | 356 | 0 | 0 | 449 | 1,319 | 1,865 | 365 | 1,592 | 1,084 | 704 | 662 | 326 |
| 2000 | 1,680 | 1,578 | 613 | 508 | 0 | 747 | 1,692 | 579 | 972 | 557 | 352 | 1,118 |
| 2001 | 180 | 377 | 0 | 693 | 378 | 321 | 0 | 429 | 0 | 0 | 0 | 0 |
| 2002 | 647 | 0 | 0 | 498 | 258 | 361 | 1,050 | 300 | 319 | 25 | 694 | 0 |
| 2003 | 164 | 0 | 462 | 918 | 878 | 210 | 117 | 377 | 270 | 140 | 297 | 363 |
| 2004 | 1,125 | 1,140 | 188 | 307 | 145 | 358 | 321 | 461 | 1,563 | 493 | 1,659 | |
| 2005 | 869 | 462 | 2,006 | 2,309 | 795 | 806 | 762 | 1,572 | 1,164 | 1,317 | 930 | |
| 2006 | 1,046 | 1,188 | 215 | 798 | 1,355 | 1,034 | 1,597 | 1,712 | 1,614 | 1,103 | 1,325 | 280 |
| 2007 | 1,332 | 1,039 | 1,398 | 2,069 | 1,927 | 1,776 | 2,634 | 1,485 | 2,249 | 2,163 | 2,443 | 2,801 |
| 2008 | 3,513 | 2,357 | 3,943 | 2,117 | 2,973 | 4,658 | 1,857 | 3,332 | 1,403 | 2,294 | 929 | 1,573 |
| 2009 | 2,700 | 832 | 3,982 | 4,047 | 2,730 | 2,229 | 2,546 | 599 | 1,963 | 824 | 1,693 | 917 |
| 2010 | 767 | 1,137 | 1,510 | 2,503 | 2,047 | 805 | 2,181 | 1,060 | 1,400 | 690 | 1,463 | 1,451 |
| 2011 | 2,161 | 1,390 | 1,382 | 2,303 | 1,379 | 2,671 | 370 | 481 | 701 | 1,021 | 1,043 | 2,431 |
| 2012 | 1,807 | 121 | 866 | 1,259 | 760 | 697 | 1,079 | 413 | 1,362 | 819 | 697 | 576 |
| 2013 | 183 | 1,735 | 972 | 669 | 1,141 | 1,204 | 2,264 | 2,275 | 1,670 | 1,464 | 1,462 | 586 |
| 2014 | 559 | 447 | 852 | 2,032 | 401 | 373 | 1,242 | 591 | 1,331 | 576 | 423 | 563 |
| 2015 | 462 | 1,160 | 951 | 196 | 1,545 | 458 | 418 | 888 | 714 | 1,031 | 918 | 1,382 |
| 2016 | 2,164 | 1,114 | 3,291 | 1,862 | 1,577 | 3,166 | 1,690 | 774 | 1,119 | 506 | 2,057 | 1,214 |
| 2017 | 1,207 | 2,318 | 2,449 | 1,038 | 2,123 | 1,754 | 1,340 | 1,114 | 2,066 | 1,378 | 881 | 2,386 |
| 2018 | 1,314 | 1,277 | 1,026 | 1,446 | 2,612 | 3,111 | 1,476 | 2,175 | 2,022 | 1,527 | 1,203 | 1,449 |
| 2019 | 1,362 | 1,072 | 944 | 550 | 1,855 | 595 | 748 | 1,368 | 1,560 | 798 | 2,840 | 2,239 |
| 2020 | 3,041 | 3,084 | 1,810 | 3,540 | 2,297 | 2,031 | 2,791 | 3,411 | 4,586 | 1,424 | 3,572 | 1,637 |
| 2021 | 3,707 | 993 | 1,895 | 2,507 | 3,283 | 5,034 | 3,185 | 3,950 | 3,839 | 3,324 | 3,532 | 3,546 |
| 2022 | 2,745 | 3,668 | 4,229 | 3,325 | 3,211 | 4,512 | 2,453 | 3,062 | 3,865 | 2,998 | 3,670 | 3,622 |
| 2023 | 1,471 | 2,109 | 1,328 | 938 | 937 | 1,520 | 1,380 | 759 | 682 | 1,248 | 1,274 | 956 |
| 2024 | 1,232 | |||||||||||
| - = No Data Reported; -- = Not Applicable; NA = Not Available; W = Withheld to avoid disclosure of individual company data. |
| Release Date: 3/29/2024 |
| Next Release Date: 4/30/2024 |