|
Download Data (XLS File) |
|
||||||||
|
||||||||
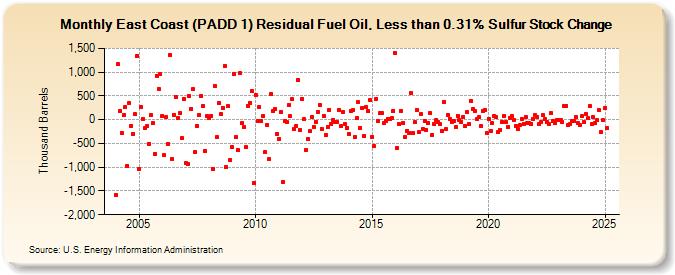
| East Coast (PADD 1) Residual Fuel Oil, Less than 0.31% Sulfur Stock Change (Thousand Barrels) | ||||||||
| Year | Jan | Feb | Mar | Apr | May | Jun | Jul | Aug | Sep | Oct | Nov | Dec |
|---|---|---|---|---|---|---|---|---|---|---|---|---|
| 2004 | -1,577 | 1,164 | 176 | -283 | 97 | 269 | -971 | 350 | -129 | -291 | 118 | 1,344 |
| 2005 | -1,040 | 267 | 16 | -173 | -136 | -510 | 94 | -75 | -717 | 924 | 651 | 954 |
| 2006 | 72 | -752 | 53 | -506 | 1,366 | -832 | 106 | 474 | 41 | 142 | -393 | 441 |
| 2007 | -921 | -932 | 501 | 226 | 640 | -683 | -128 | 99 | 500 | 289 | -659 | 77 |
| 2008 | 39 | 83 | -1,031 | 709 | -374 | 357 | 109 | 248 | 1,132 | -1,005 | 280 | -845 |
| 2009 | -582 | 966 | -365 | -646 | 979 | -77 | -151 | -576 | 294 | 354 | 607 | -1,329 |
| 2010 | 523 | -23 | 267 | -27 | 76 | -690 | -104 | -828 | 545 | 189 | 223 | -297 |
| 2011 | -401 | 160 | -1,318 | -32 | -58 | 310 | 68 | 429 | -194 | -126 | 845 | -215 |
| 2012 | 440 | 7 | -630 | -402 | -245 | 66 | -147 | -39 | 170 | 316 | -190 | 82 |
| 2013 | -318 | -159 | 213 | -86 | -1 | -58 | -54 | 204 | -134 | 165 | -87 | -170 |
| 2014 | -297 | 188 | 194 | -360 | 36 | 364 | -170 | 246 | -341 | 260 | 181 | 413 |
| 2015 | -358 | -561 | 445 | -31 | 131 | 132 | -77 | -21 | 15 | 8 | 30 | 193 |
| 2016 | 1,402 | -596 | -100 | 190 | -60 | -361 | -232 | -279 | 555 | -277 | -56 | 206 |
| 2017 | -267 | 118 | -205 | -22 | -214 | -65 | 130 | -321 | -86 | -9 | -50 | -97 |
| 2018 | -228 | 381 | -204 | 104 | 22 | -48 | -26 | -162 | 86 | 0 | -45 | 52 |
| 2019 | -132 | 164 | -82 | 394 | 216 | 183 | 7 | 52 | -134 | 188 | 202 | -282 |
| 2020 | 22 | -241 | -66 | 70 | 50 | -263 | -209 | -40 | 83 | -54 | -145 | 43 |
| 2021 | 67 | -3 | -129 | -199 | -119 | 17 | -88 | 55 | -69 | -74 | -82 | 4 |
| 2022 | 93 | 61 | -97 | -57 | 90 | 9 | -41 | -95 | 139 | -29 | -76 | -11 |
| 2023 | -1 | -2 | -54 | 295 | 298 | -122 | -87 | -33 | -19 | 60 | -74 | -120 |
| 2024 | 69 | -50 | 122 | 26 | 287 | -96 | 50 | -79 | -13 | 201 | -262 | -2 |
| 2025 | 255 | -175 | -294 | 76 | ||||||||
| - = No Data Reported; -- = Not Applicable; NA = Not Available; W = Withheld to avoid disclosure of individual company data. |
| Release Date: 6/30/2025 |
| Next Release Date: 7/31/2025 |