|
Download Data (XLS File) |
|
||||||||
|
||||||||
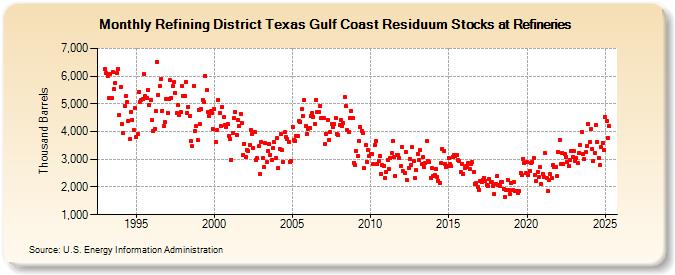
| Refining District Texas Gulf Coast Residuum Stocks at Refineries (Thousand Barrels) | ||||||||
| Year | Jan | Feb | Mar | Apr | May | Jun | Jul | Aug | Sep | Oct | Nov | Dec |
|---|---|---|---|---|---|---|---|---|---|---|---|---|
| 1993 | 6,267 | 6,105 | 5,998 | 5,205 | 6,092 | 5,201 | 6,152 | 5,525 | 5,753 | 6,107 | 6,266 | 4,603 |
| 1994 | 5,619 | 4,270 | 3,948 | 4,915 | 5,298 | 5,058 | 4,391 | 3,717 | 4,719 | 4,421 | 4,060 | 4,843 |
| 1995 | 3,806 | 3,908 | 5,439 | 5,084 | 5,154 | 5,162 | 6,080 | 5,272 | 5,227 | 5,501 | 4,954 | 5,137 |
| 1996 | 4,403 | 4,019 | 4,091 | 4,725 | 6,507 | 5,332 | 5,652 | 5,911 | 4,758 | 4,187 | 4,329 | 5,185 |
| 1997 | 4,685 | 5,159 | 5,845 | 5,208 | 5,630 | 5,791 | 5,393 | 4,665 | 4,944 | 4,606 | 4,711 | 5,648 |
| 1998 | 5,298 | 5,280 | 5,802 | 4,677 | 4,889 | 4,573 | 3,653 | 3,469 | 5,657 | 4,005 | 4,183 | 3,685 |
| 1999 | 4,789 | 4,256 | 4,830 | 5,147 | 5,063 | 6,010 | 5,484 | 4,714 | 4,573 | 4,732 | 4,662 | 4,082 |
| 2000 | 4,805 | 3,632 | 4,053 | 5,155 | 4,677 | 4,204 | 4,890 | 4,508 | 4,246 | 4,147 | 4,272 | 3,835 |
| 2001 | 3,724 | 2,984 | 3,949 | 4,488 | 4,706 | 3,891 | 4,416 | 4,207 | 4,646 | 4,314 | 3,149 | 3,569 |
| 2002 | 3,069 | 3,350 | 3,296 | 3,522 | 4,069 | 3,904 | 3,412 | 3,973 | 2,960 | 3,029 | 3,466 | 2,464 |
| 2003 | 3,626 | 3,042 | 2,715 | 3,582 | 2,899 | 3,306 | 3,542 | 3,171 | 2,970 | 3,402 | 3,608 | 3,045 |
| 2004 | 3,760 | 2,703 | 3,384 | 3,898 | 3,327 | 2,897 | 3,974 | 3,820 | 3,727 | 3,637 | 2,919 | 2,940 |
| 2005 | 4,181 | 3,710 | 3,667 | 3,840 | 3,846 | 4,387 | 4,360 | 4,797 | 4,575 | 5,123 | 4,212 | 3,914 |
| 2006 | 4,080 | 4,141 | 4,567 | 4,673 | 4,534 | 4,287 | 5,131 | 4,713 | 4,688 | 4,930 | 4,493 | 4,473 |
| 2007 | 4,479 | 3,542 | 3,914 | 4,423 | 3,704 | 3,990 | 4,261 | 4,161 | 4,279 | 4,479 | 3,922 | 3,862 |
| 2008 | 4,231 | 4,424 | 4,202 | 4,292 | 5,240 | 4,910 | 4,067 | 3,991 | 4,504 | 4,758 | 4,486 | 2,875 |
| 2009 | 2,776 | 3,302 | 3,113 | 3,656 | 4,166 | 4,030 | 3,955 | 2,675 | 3,528 | 2,903 | 3,331 | 3,120 |
| 2010 | 3,204 | 3,182 | 2,827 | 3,499 | 3,659 | 2,827 | 2,948 | 3,109 | 2,484 | 2,790 | 2,751 | 2,330 |
| 2011 | 2,545 | 2,983 | 2,643 | 3,063 | 3,217 | 3,647 | 3,087 | 2,411 | 3,163 | 3,172 | 3,033 | 2,754 |
| 2012 | 3,456 | 2,563 | 2,514 | 3,245 | 2,236 | 2,697 | 3,014 | 2,809 | 3,430 | 2,930 | 2,321 | 2,611 |
| 2013 | 3,207 | 2,976 | 3,324 | 2,837 | 3,071 | 2,705 | 2,875 | 3,653 | 2,929 | 2,898 | 2,339 | 2,687 |
| 2014 | 2,382 | 2,434 | 2,655 | 2,344 | 2,231 | 2,148 | 2,849 | 3,364 | 3,315 | 2,844 | 2,735 | 2,770 |
| 2015 | 3,036 | 2,815 | 2,740 | 3,091 | 3,165 | 3,127 | 3,149 | 2,967 | 2,934 | 2,533 | 2,826 | 2,478 |
| 2016 | 2,689 | 2,763 | 2,737 | 2,860 | 2,639 | 2,847 | 2,884 | 2,550 | 2,125 | 2,132 | 1,988 | 1,890 |
| 2017 | 2,223 | 2,179 | 2,260 | 2,341 | 2,234 | 2,085 | 2,022 | 2,273 | 2,187 | 2,163 | 2,026 | 1,755 |
| 2018 | 2,126 | 2,388 | 2,063 | 2,037 | 2,184 | 2,198 | 1,933 | 1,642 | 1,893 | 2,262 | 1,898 | 1,738 |
| 2019 | 2,150 | 1,895 | 2,187 | 1,865 | 1,864 | 1,781 | 1,856 | 2,515 | 2,420 | 3,024 | 2,878 | 2,493 |
| 2020 | 2,905 | 2,424 | 2,593 | 2,868 | 2,906 | 3,057 | 2,433 | 2,202 | 2,544 | 2,350 | 2,708 | 2,102 |
| 2021 | 2,482 | 2,348 | 3,217 | 2,332 | 1,840 | 2,269 | 2,459 | 2,325 | 2,790 | 2,726 | 2,727 | 2,382 |
| 2022 | 3,268 | 3,710 | 2,817 | 3,244 | 2,812 | 3,206 | 3,075 | 2,890 | 2,745 | 2,982 | 3,282 | 3,069 |
| 2023 | 3,283 | 2,922 | 3,046 | 2,874 | 3,231 | 3,515 | 3,998 | 3,205 | 2,992 | 3,248 | 3,490 | 4,264 |
| 2024 | 3,622 | |||||||||||
| - = No Data Reported; -- = Not Applicable; NA = Not Available; W = Withheld to avoid disclosure of individual company data. |
| Release Date: 3/29/2024 |
| Next Release Date: 4/30/2024 |
Referring Pages: