|
Download Data (XLS File) |
|
||||||||
|
||||||||
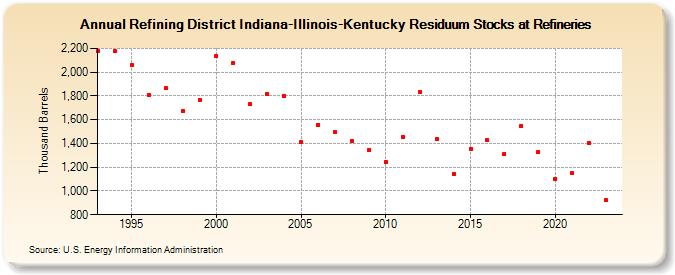
| Refining District Indiana-Illinois-Kentucky Residuum Stocks at Refineries (Thousand Barrels) | ||||||||
| Decade | Year-0 | Year-1 | Year-2 | Year-3 | Year-4 | Year-5 | Year-6 | Year-7 | Year-8 | Year-9 |
|---|---|---|---|---|---|---|---|---|---|---|
| 1990's | 2,175 | 2,179 | 2,062 | 1,806 | 1,866 | 1,672 | 1,769 | |||
| 2000's | 2,132 | 2,074 | 1,729 | 1,815 | 1,803 | 1,411 | 1,559 | 1,493 | 1,423 | 1,346 |
| 2010's | 1,246 | 1,458 | 1,835 | 1,436 | 1,144 | 1,355 | 1,426 | 1,315 | 1,550 | 1,332 |
| 2020's | 1,101 | 1,147 | 1,402 | 921 |
| - = No Data Reported; -- = Not Applicable; NA = Not Available; W = Withheld to avoid disclosure of individual company data. |
| Release Date: 8/30/2024 |
| Next Release Date: 8/29/2025 |