|
Download Data (XLS File) |
|
||||||||
|
||||||||
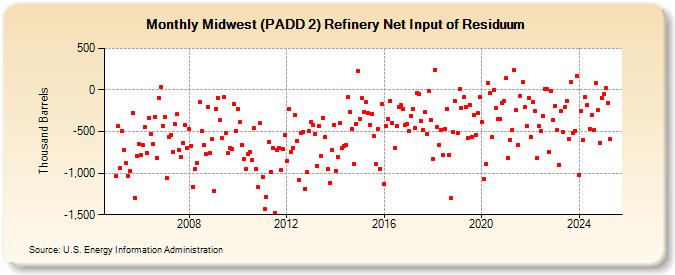
| Midwest (PADD 2) Refinery Net Input of Residuum (Thousand Barrels) | ||||||||
| Year | Jan | Feb | Mar | Apr | May | Jun | Jul | Aug | Sep | Oct | Nov | Dec |
|---|---|---|---|---|---|---|---|---|---|---|---|---|
| 2005 | -1,037 | -432 | -940 | -498 | -723 | -884 | -1,033 | -978 | -271 | -1,294 | -788 | -647 |
| 2006 | -776 | -657 | -451 | -753 | -342 | -533 | -647 | -320 | -817 | -91 | 33 | -428 |
| 2007 | -324 | -1,062 | -564 | -541 | -750 | -415 | -293 | -722 | -806 | -637 | -425 | -693 |
| 2008 | -473 | -673 | -1,163 | -951 | -879 | -141 | -497 | -666 | -772 | -204 | -762 | -593 |
| 2009 | -1,211 | -229 | -91 | -364 | -578 | -85 | -517 | -761 | -698 | -713 | -172 | -493 |
| 2010 | -226 | -384 | -658 | -829 | -945 | -765 | -741 | -841 | -463 | -945 | -1,170 | -401 |
| 2011 | -1,049 | -1,431 | -1,286 | -623 | -985 | -700 | -1,476 | -719 | -696 | -966 | -714 | -538 |
| 2012 | -852 | -224 | -744 | -699 | -302 | -612 | -1,078 | -517 | -500 | -1,186 | -992 | -496 |
| 2013 | -385 | -422 | -532 | -916 | -436 | -796 | -337 | -568 | -947 | -1,117 | -727 | -421 |
| 2014 | -971 | -807 | -402 | -697 | -670 | -666 | -89 | -266 | -475 | -894 | -405 | 225 |
| 2015 | -345 | -99 | -260 | -145 | -278 | -419 | -288 | -559 | -891 | -466 | -946 | -169 |
| 2016 | -1,128 | -436 | -346 | -128 | -395 | -703 | -435 | -207 | -184 | -228 | -426 | -407 |
| 2017 | -499 | -309 | -230 | -458 | -41 | -44 | -376 | -480 | -265 | -527 | -8 | -356 |
| 2018 | -829 | 246 | -449 | -657 | -476 | -786 | -467 | -233 | -781 | -1,305 | -508 | -138 |
| 2019 | -518 | 11 | -219 | -90 | -204 | -577 | -176 | -562 | -300 | -537 | -279 | -89 |
| 2020 | -383 | -1,073 | -895 | 87 | -42 | -571 | 5 | -222 | -354 | -350 | -161 | -138 |
| 2021 | 143 | -818 | -601 | -476 | 239 | -246 | -657 | -73 | 93 | -204 | -434 | -92 |
| 2022 | -563 | -140 | -255 | -816 | -438 | -490 | -313 | 6 | 9 | -748 | -13 | -358 |
| 2023 | -165 | -486 | -898 | -256 | -503 | -203 | -137 | -585 | 92 | -517 | -488 | 169 |
| 2024 | -1,021 | -257 | -597 | -86 | ||||||||
| - = No Data Reported; -- = Not Applicable; NA = Not Available; W = Withheld to avoid disclosure of individual company data. |
| Release Date: 6/28/2024 |
| Next Release Date: 7/31/2024 |