|
Download Data (XLS File) |
|
||||||||
|
||||||||
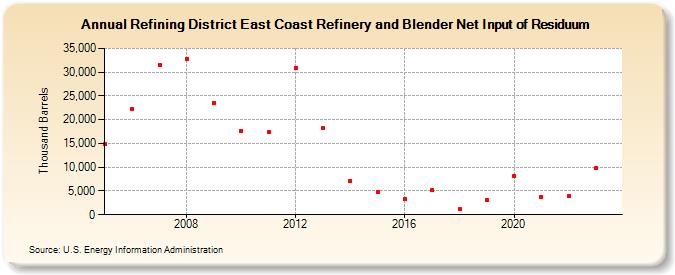
| Refining District East Coast Refinery and Blender Net Input of Residuum (Thousand Barrels) | ||||||||
| Decade | Year-0 | Year-1 | Year-2 | Year-3 | Year-4 | Year-5 | Year-6 | Year-7 | Year-8 | Year-9 |
|---|---|---|---|---|---|---|---|---|---|---|
| 2000's | 14,792 | 22,334 | 31,581 | 32,855 | 23,595 | |||||
| 2010's | 17,715 | 17,429 | 30,912 | 18,286 | 7,052 | 4,806 | 3,237 | 5,171 | 1,253 | 3,104 |
| 2020's | 8,167 | 3,825 | 3,878 | 9,728 |
| - = No Data Reported; -- = Not Applicable; NA = Not Available; W = Withheld to avoid disclosure of individual company data. |
| Release Date: 6/28/2024 |
| Next Release Date: 8/30/2024 |