|
Download Data (XLS File) |
|
||||||||
|
||||||||
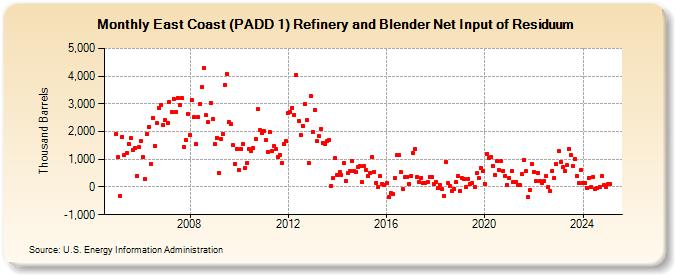
| East Coast (PADD 1) Refinery and Blender Net Input of Residuum (Thousand Barrels) | ||||||||
| Year | Jan | Feb | Mar | Apr | May | Jun | Jul | Aug | Sep | Oct | Nov | Dec |
|---|---|---|---|---|---|---|---|---|---|---|---|---|
| 2005 | 1,915 | 1,067 | -331 | 1,821 | 1,162 | 1,225 | 1,556 | 1,757 | 1,321 | 1,389 | 398 | 1,431 |
| 2006 | 1,668 | 1,076 | 288 | 1,922 | 2,176 | 835 | 2,506 | 1,471 | 2,295 | 2,854 | 2,975 | 2,237 |
| 2007 | 2,421 | 2,298 | 3,077 | 2,707 | 3,180 | 2,697 | 3,221 | 2,965 | 3,216 | 1,456 | 1,693 | 2,624 |
| 2008 | 1,873 | 3,127 | 2,515 | 1,537 | 2,510 | 2,985 | 3,599 | 4,296 | 2,582 | 2,341 | 3,033 | 2,435 |
| 2009 | 1,556 | 1,785 | 521 | 1,732 | 1,911 | 3,669 | 4,081 | 2,339 | 2,259 | 1,502 | 846 | 1,379 |
| 2010 | 614 | 1,379 | 1,554 | 701 | 881 | 1,357 | 1,283 | 1,392 | 1,723 | 2,802 | 2,044 | 1,939 |
| 2011 | 2,019 | 1,681 | 1,273 | 1,967 | 1,306 | 1,478 | 1,359 | 1,093 | 1,147 | 883 | 1,553 | 1,655 |
| 2012 | 2,684 | 2,699 | 2,860 | 2,599 | 4,034 | 2,388 | 1,880 | 2,213 | 2,983 | 2,421 | 867 | 3,273 |
| 2013 | 1,983 | 2,795 | 1,647 | 1,830 | 2,110 | 1,580 | 1,559 | 1,667 | 1,694 | 42 | 327 | 1,045 |
| 2014 | 421 | 531 | 424 | 859 | 210 | 494 | 570 | 955 | 569 | 547 | 716 | 754 |
| 2015 | 167 | 742 | 604 | 402 | 508 | 1,070 | 549 | 161 | -3 | 384 | 118 | 58 |
| 2016 | 152 | -367 | -209 | -266 | 324 | 1,145 | 1,141 | 524 | -76 | 345 | 374 | 124 |
| 2017 | 399 | 1,211 | 1,364 | 363 | 175 | 340 | 128 | 155 | 185 | 367 | 364 | 105 |
| 2018 | 183 | -36 | 77 | -64 | -324 | 900 | 130 | 18 | -150 | -80 | 174 | 403 |
| 2019 | -144 | 307 | 290 | 12 | 304 | 95 | 146 | 12 | 487 | 318 | 684 | 592 |
| 2020 | 111 | 1,201 | 1,029 | 1,068 | 758 | 444 | 924 | 617 | 931 | 589 | 399 | 76 |
| 2021 | 326 | 571 | 186 | 193 | 59 | 89 | 453 | 987 | 559 | -356 | -106 | 823 |
| 2022 | 557 | 201 | 517 | 205 | 156 | 226 | 387 | 3 | -151 | 590 | 332 | 845 |
| 2023 | 1,301 | 908 | 710 | 575 | 783 | 1,381 | 1,148 | 757 | 1,003 | 397 | 129 | 626 |
| 2024 | 152 | 137 | -21 | 335 | ||||||||
| - = No Data Reported; -- = Not Applicable; NA = Not Available; W = Withheld to avoid disclosure of individual company data. |
| Release Date: 6/28/2024 |
| Next Release Date: 7/31/2024 |