|
Download Data (XLS File) |
|
||||||||
|
||||||||
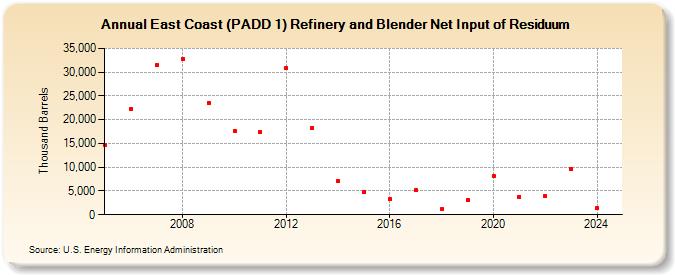
| East Coast (PADD 1) Refinery and Blender Net Input of Residuum (Thousand Barrels) | ||||||||
| Decade | Year-0 | Year-1 | Year-2 | Year-3 | Year-4 | Year-5 | Year-6 | Year-7 | Year-8 | Year-9 |
|---|---|---|---|---|---|---|---|---|---|---|
| 2000's | 14,711 | 22,303 | 31,555 | 32,833 | 23,580 | |||||
| 2010's | 17,669 | 17,414 | 30,901 | 18,279 | 7,050 | 4,760 | 3,211 | 5,156 | 1,231 | 3,103 |
| 2020's | 8,147 | 3,784 | 3,868 | 9,718 |
| - = No Data Reported; -- = Not Applicable; NA = Not Available; W = Withheld to avoid disclosure of individual company data. |
| Release Date: 6/28/2024 |
| Next Release Date: 8/30/2024 |