|
Download Data (XLS File) |
|
||||||||
|
||||||||
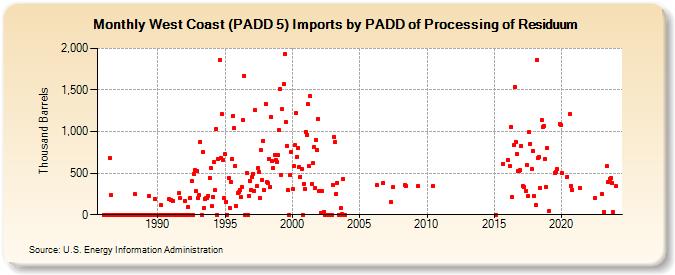
| West Coast (PADD 5) Imports by PADD of Processing of Residuum (Thousand Barrels) | ||||||||
| Year | Jan | Feb | Mar | Apr | May | Jun | Jul | Aug | Sep | Oct | Nov | Dec |
|---|---|---|---|---|---|---|---|---|---|---|---|---|
| 1986 | 0 | 0 | 0 | 0 | 0 | 687 | 238 | 0 | 0 | 0 | 0 | 0 |
| 1987 | 0 | 0 | 0 | 0 | 0 | 0 | 0 | 0 | 0 | 0 | 0 | 0 |
| 1988 | 0 | 0 | 0 | 0 | 244 | 0 | 0 | 0 | 0 | 0 | 0 | 0 |
| 1989 | 0 | 0 | 0 | 0 | 231 | 0 | 0 | 0 | 0 | 190 | 0 | 0 |
| 1990 | 0 | 0 | 0 | 116 | 0 | 0 | 0 | 0 | 0 | 0 | 188 | 0 |
| 1991 | 179 | 164 | 0 | 0 | 0 | 0 | 0 | 261 | 201 | 0 | 0 | 0 |
| 1992 | 166 | 0 | 0 | 95 | 0 | 201 | 406 | 0 | 495 | 537 | 282 | 528 |
| 1993 | 206 | 237 | 880 | 0 | 749 | 83 | 189 | 196 | 202 | 230 | 445 | 564 |
| 1994 | 101 | 219 | 639 | 293 | 1,031 | 0 | 673 | 1,864 | 683 | 1,210 | 663 | 200 |
| 1995 | 726 | 157 | 0 | 440 | 81 | 396 | 672 | 1,190 | 1,038 | 591 | 105 | 261 |
| 1996 | 269 | 303 | 207 | 331 | 1,134 | 1,674 | 0 | 497 | 0 | 230 | 409 | 303 |
| 1997 | 459 | 490 | 289 | 1,259 | 345 | 558 | 513 | 200 | 774 | 415 | 891 | 296 |
| 1998 | 1,335 | 396 | 376 | 673 | 334 | 1,172 | 640 | 557 | 720 | 662 | 635 | 718 |
| 1999 | 1,018 | 1,517 | 479 | 1,266 | 1,569 | 1,927 | 1,114 | 832 | 292 | 0 | 472 | 757 |
| 2000 | 311 | 589 | 835 | 1,218 | 699 | 804 | 575 | 459 | 551 | 0 | 373 | 313 |
| 2001 | 999 | 960 | 1,327 | 582 | 1,427 | 370 | 618 | 811 | 324 | 899 | 776 | 1,153 |
| 2002 | 285 | 20 | 287 | 25 | 36 | 0 | 0 | 0 | 0 | 0 | 0 | 0 |
| 2003 | 361 | 939 | 877 | 255 | 387 | 0 | 0 | 76 | 7 | 427 | 0 | 0 |
| 2006 | 353 | 386 | ||||||||||
| 2007 | 150 | 333 | ||||||||||
| 2008 | 352 | 351 | ||||||||||
| 2009 | 348 | |||||||||||
| 2010 | 344 | |||||||||||
| 2015 | 1 | 613 | ||||||||||
| 2016 | 660 | 585 | 1,057 | 212 | 833 | 1,541 | 880 | 728 | 530 | 524 | 534 | |
| 2017 | 826 | 343 | 331 | 290 | 597 | 220 | 990 | 855 | 554 | 767 | 221 | |
| 2018 | 115 | 1,863 | 683 | 689 | 316 | 1,140 | 1,055 | 1,066 | 672 | 336 | 807 | |
| 2019 | 45 | 504 | 512 | 546 | 1,089 | 1,081 | ||||||
| 2020 | 504 | 459 | 1,208 | 347 | 298 | |||||||
| 2021 | 320 | |||||||||||
| 2022 | 202 | |||||||||||
| 2023 | 254 | 38 | 582 | 389 | 430 | 443 | 383 | 33 | ||||
| 2024 | 341 | |||||||||||
| - = No Data Reported; -- = Not Applicable; NA = Not Available; W = Withheld to avoid disclosure of individual company data. |
| Release Date: 3/29/2024 |
| Next Release Date: 4/30/2024 |